
Fig. 4
- ID
- ZDB-FIG-160913-3
- Publication
- Veldman et al., 2015 - The N17 domain mitigates nuclear toxicity in a novel zebrafish Huntington's disease model
- Other Figures
- All Figure Page
- Back to All Figure Page
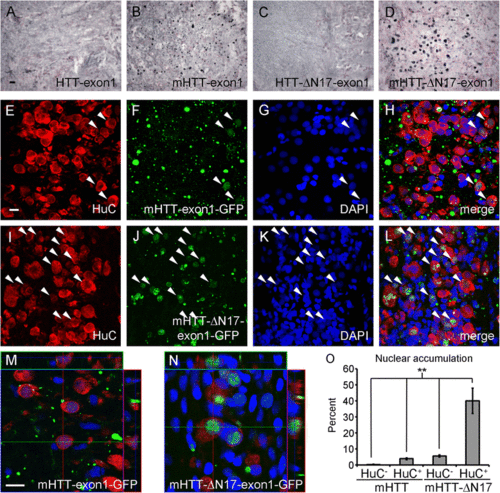
mHTT-ΔN17-exon1 accumulates mainly in the nucleus of neurons while mHTT-exon1 aggregates are mostly outside the neuronal cell body. Brain sections from 26 week old HTT-exon1 and mHTT-exon1 fish or 12 week old HTT-ΔN17-exon1 and mHTT-ΔN17-exon1, Stage 3 fish were immunostained to observe the transgenic HTT-exon1 localization. All images are from the hindbrain region and similar staining was present throughout all brain regions in each fish. a-d S830 anti-human HTT Exon 1 antibody was used to detect transgene expression in each transgenic line. HTT-exon1 (a) and HTT-ΔN17-exon1 (c) tissue exhibits uniform, ubiquitous expression. mHTT-exon1 (b) tissue displays many small but distinct aggregates while mHTT-ΔN17-exon1 (d) tissue has many large aggregates. Scale bar equals 25 µm. e-l Immunofluorescent staining of mHTT-exon1 (e-h) and mHTT-ΔN17-exon1 (i-l) transgenic fish for neurons (HuC), transgenic HTT-exon1-GFP fusion protein, and nuclei (DAPI). mHTT-exon1 tissue exhibits many small GFP+ aggregates that are not generally associated with HuC positive neuronal cell bodies suggesting they are either in the axons or dendrites or are non-neuronal (e-h). Occasional, weak nuclear accumulation is present in a few neurons (white arrowheads). mHTT-ΔN17-exon1 tissue has many neuronal, HuC positive, nuclei co-localized with HTT-exon1-GFP (i-l). Scale bar equals 10 µm. m and n 3D confocal projections of mHTT-exon1 (m) and mHTT-ΔN17-exon1 (n) tissue demonstrating weak nuclear HTT-exon1-GFP staining in mHTT-exon1 and strong nuclear staining in mHTT-ΔN17-exon1. Scale bar equals 10 µm. o Quantification of protein accumulation location. Nuclear HTT-exon1 aggregates were rare in HuC negative cells of both lines and mHTT-exon1 transgenic HuC positive neurons. mHTT-ΔN17-exon1 transgenic fish exhibited robust nuclear accumulation of HTT-exon1-GFP in ~40 % of HuC positive cells. ANOVA with Bonferroni posthoc test, (**) p < 0.01 |
| Gene: | |
|---|---|
| Fish: | |
| Condition: | |
| Anatomical Term: | |
| Stage: | Adult |