Fig. 3
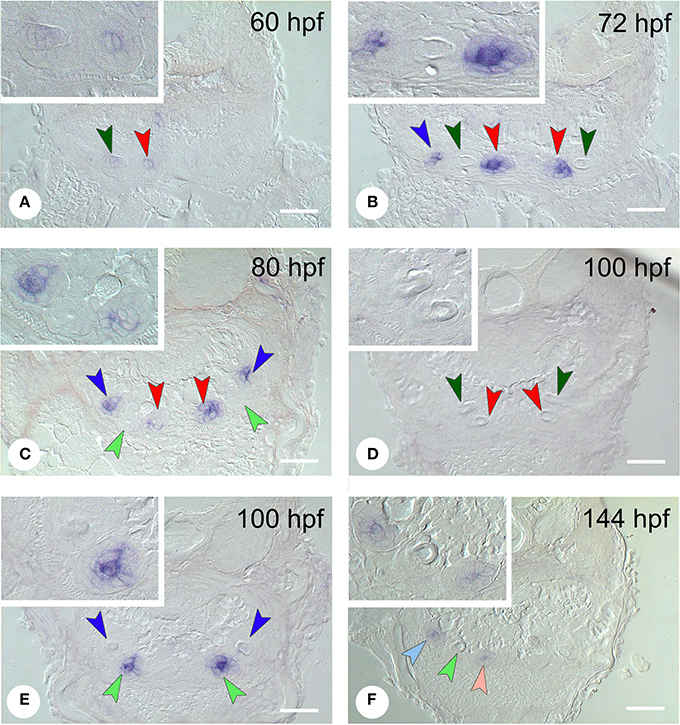
Expression of dkk1 in different stages of development of first- and second-generation teeth. (A) 60 hpf: weak mesenchymal expression in tooth 4V1, epithelial expression starts to be upregulated in 3V1; (B) 72 hpf: strong epithelial expression in 3V1 and 5V1, but loss of signal in 4V1; (C) 80 hpf: start of formation of 4V2 showing no signal yet; epithelial signal is weakening in 3V1 and 5V1; (D,E) 100 hpf; dkk1 is now downregulated in all first-generation teeth [3V1 and 4V1 in (D), 5V1 in (E)], whilst the gene is upregulated in the first replacement tooth (4V2); (F) 144 hpf: expression in the two next second-generation teeth, 3V2 and 5V2. Dark-colored arrowheads indicate specific first-generation teeth and point downwards: dark green, 4V1, red, 3V1, dark blue, 5V1; light-colored arrowheads indicate second-generation teeth and point upwards: light green, 4V2, pink, 3V2, light blue, 5V2. Note that epithelium and mesenchyme of a tooth germ are not necessarily visible on a single section through the germ. Sections may also be slightly oblique and different sets of teeth may be visible on either body side. Insets show higher magnification of the teeth on the left side in each micrograph. Scale bars = 50 µm.

