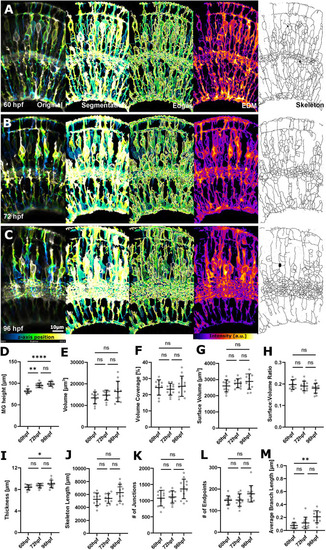
Fig. 6.
|
Increased MG feature extraction using membrane-tagged fluorescent reporter lines. (A-C) Micrographs of original and processed data at 60, 72 and 96 hpf. a.u., arbitrary unit. (D) MG height was statistically significant increased from 60 to 96 hpf (****P<0.0001). (E) Volume was not statistically significantly changed (P=0.2197). (F) Volume coverage was not statistically significantly changed (P=0.7728). (G) Surface volume was not statistically significantly changed (P=0.3036). (H) Surface-to-volume ratio was not statistically significantly changed (P=0.3570). (I) Thickness was statistically significantly increased from 60 to 96 hpf (*P=0.0466). (J) Skeleton length was not statistically significantly changed (P=0.1095). (K) The number of junctions was not statistically significantly changed (P=0.0741). (L) The number of endpoints was not statistically significantly changed (P=0.0690). (M) Average branch length was statistically significantly increased from 60 to 96 hpf (**P=0.0018). 60 hpf n=11, 72 hpf n=12, 96 hpf n=13; N=2 experimental repeats; Kruskal–Wallis test; mean±s.d. All P-values refer to the comparison of the 60 and 96 hpf time points. |

