
- Title
-
Pleiotropic contribution of rbfox1 to psychiatric and neurodevelopmental phenotypes in two zebrafish models
- Authors
- Antón-Galindo, E., Adel, M.R., García-González, J., Leggieri, A., López-Blanch, L., Irimia, M., Norton, W.H.J., Brennan, C.H., Fernàndez-Castillo, N., Cormand, B.
- Source
- Full text @ Transl Psychiatry
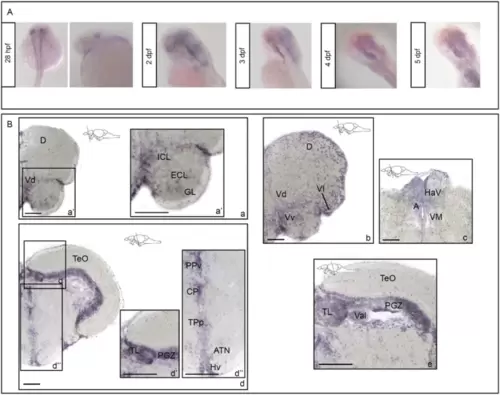
rbfox1 shows restricted neuronal expression during development and is localised to specific forebrain, midbrain and hindbrain areas during adulthood.rbfox1 in situ hybridisation on (A) zebrafish whole mount larvae and (B) adult zebrafish brains, TL background. A rbfox1 whole mount in situ hybridisation on zebrafish larvae at 28 h post fertilisation, 3-, 4- and 5-days post fertilisation. B rbfox1 in situ hybridisation on adult zebrafish brains, (a–c) forebrain and (d–e) midbrain transverse sections. A anterior thalamic nuclei; ATN, anterior tuberal nucleus; CP, central posterior thalamic nucleus; D, dorsal telencephalic area; GL, glomerular cellular layer; HaV, ventral habenular nucleus; Hv, ventral zone of periventricular hypothalamus; ICL, internal cellular layer; PGZ, periventricular grey zone; PPv, ventral part of the periventricular pretectal nucleus; TeO, optic tectum; TL, torus longitudinalis; TPp, periventricular nucleus of posterior tuberculum; Val, valvula cerebelli; Vd, dorsal nucleus of ventral telencephalic area; Vl, lateral nucleus of ventral telencephalic area; VM, ventromedial thalamic nuclei; Vv, ventral nucleus of ventral telencephalic area. Scale bars: 100 µm (a, b, c, d); 200 µm (a’, d’, d”, e). EXPRESSION / LABELING:
|

Relative expression of rbfox family mRNAs in adult brains and 3dpf larvae from the rbfox1sa15940 line. Adult brains: Relative brain expression of (A) rbfox1, (B) rbfox1l, rbfox2, rbfox3a and rbfox3b mRNA in adult brains. mRNA expression is normalised to the average expression of the mRNA in wild-type fish and to the reference housekeeping genes ribosomal protein L13a (rpl13) (A, B) or the eukaryotic translation elongation factor 1 alpha 1a (eef1a1a) (B). Kruskal-Wallis test followed by Dunn’s multiple comparison test. n = 5-7 WT, 5-7 HZ, 5-7 HOM. Mean ± SD. C Brain expression of the rbfox family mRNAs in adult wild-type zebrafish brains represented as the quantification cycle value for each gene. n = 7 WT, 7 HZ, 7 HOM. Mean ± SD. 3dpf larvae: Relative brain expression of (D) rbfox1, (E) rbfox1l, rbfox2, rbfox3a and rbfox3b mRNA in 3 dpf whole larvae. mRNA expression is normalised to the average expression of the mRNA in wild-type fish and to the reference housekeeping gene ubiquitin-conjugating enzyme E2A (ube2a). Kruskal-Wallis test followed by Dunn’s multiple comparison test. n = 5 WT, 5 HZ, 5 HOM. Mean ± SD. F Brain expression of the rbfox family mRNAs in 3 dpf wild-type larvae represented as the quantification cycle value for each gene. n = 5 WT, 5 HZ, 5 HOM. Mean ± SD. Each point represents the results from a pool of 10 larvae. EXPRESSION / LABELING:
PHENOTYPE:
|
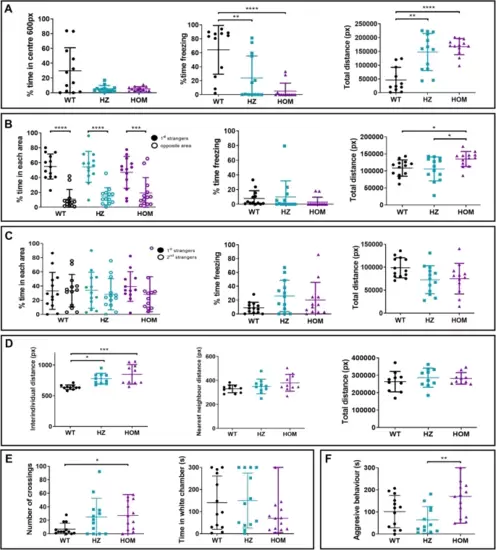
Behavioural alterations observed in the rbfox1sa15940 line.A Open field test. Time spent in the centre of the arena, time spent freezing and total distance travelled during the open field test. One-way ANOVA followed by Tukey’s multiple comparison test. B Visually-mediated social preference test (VMSP). Social preference step. Time spent in the area close to the 1st strangers and in the opposite area, time spent freezing and total distance travelled during the social preference step of the VMSP test. Two-way ANOVA followed by Sidak’s multiple comparison test. C Visually-mediated social preference test (VSMP). Preference for social novelty step. Time spent in the areas close to the 1st or 2nd strangers, time spent freezing and total distance travelled during the preference for social novelty step of the VMSP test. Two-way ANOVA followed by Sidak’s multiple comparison test. D Shoaling test. Mean of interindividual distance, nearest neighbour distance, cluster score and total distance travelled during the shoaling test. One-way ANOVA followed by Tukey’s multiple comparison test and Kruskal-Wallis followed by Dunn’s multiple comparisons test. E Black and white test. Number of crossings between areas and time spent in the white area of the tank during the black and white test. Kruskal-Wallis followed by Dunn’s multiple comparisons test. F Mirror test. Time spent exhibiting an aggressive behaviour against the mirror. For all the experiments except for the shoaling test: HOM, rbfox1sa15940/sa15940 fish; HZ, rbfox1sa15940/+ fish; WT, wild-type TL. n = 13 WT, 13 HZ and 13 HOM for all tests except for the shoaling test. For the shoaling test: n = 2 groups of 5 individuals per genotype. *p < 0.05; **p < 0.01; ***p < 0.001; ****p < 0.0001. Mean ± SD. PHENOTYPE:
|

Behavioural alterations observed in the rbfox1del19 line. A Open field test. Time spent in the centre of the arena, time spent freezing and total distance travelled during the open field test. One-way ANOVA followed by Tukey’s multiple comparison test. B Visually-mediated social preference test (VMSP). Social preference step. Time spent in the area close to the 1st strangers and in the opposite area, time spent freezing and total distance travelled during the social preference step of the VMSP test. Two-way ANOVA followed by Sidak’s multiple comparison test. C Visually-mediated social preference test (VSMP). Preference for social novelty step. Time spent in the areas close to the 1st or 2nd strangers, time spent freezing and total distance travelled during the preference for social novelty step of the VMSP test. Two-way ANOVA followed by Sidak’s multiple comparison test. D Shoaling test. Mean of interindividual distance, nearest neighbour distance, cluster score and total distance travelled during the shoaling test. One-way ANOVA followed by Tukey’s multiple comparison test and Kruskal-Wallis followed by Dunn’s multiple comparisons test. E Black and white test. Number of crossings between areas and time spent in the white area of the tank during the black and white test. Kruskal-Wallis followed by Dunn’s multiple comparisons test. F Mirror test. Time spent exhibiting an aggressive behaviour against the mirror. For all the experiments except for the shoaling test: HOM, rbfox1del19/ del19 fish; HZ, rbfox1del19/+ fish; WT, wild-type TU. n = 13 WT, 13 HZ and 13 HOM for all tests except for the shoaling test. For the shoaling test: n = 2 groups of 5 individuals per genotype. *p < 0.05; **p < 0.01; ***p < 0.001; ****p < 0.0001. Mean ± SD. PHENOTYPE:
|