
- Title
-
Oxidative and Endoplasmic Reticulum Stress Represent Novel Therapeutic Targets for Choroideremia
- Authors
- Sarkar, H., Lahne, M., Nair, N., Moosajee, M.
- Source
- Full text @ Antioxidants (Basel)
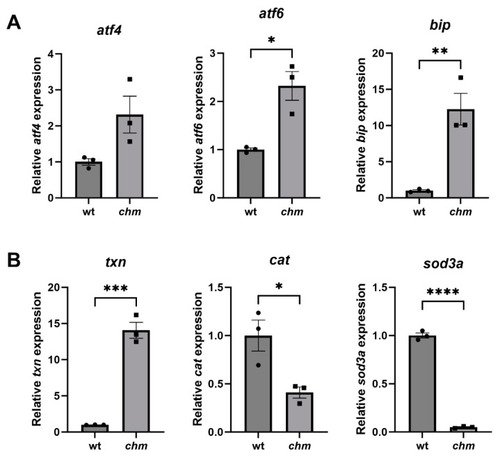
Increased ER and oxidative stress in |

Increased ER and oxidative stress in |

Analysis of ER stress in TUDCA-treated |

Analysis of ER stress in taurine-treated |

Analysis of oxidative stress in NACA-treated |
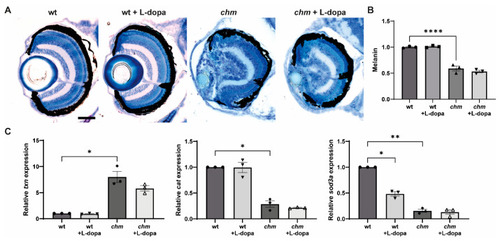
Analysis of melanin in L-dopa-treated |