
- Title
-
Zebrafish dnm1a gene plays a role in the formation of axons and synapses in the nervous tissue
- Authors
- Bragato, C., Pistocchi, A., Bellipanni, G., Confalonieri, S., Balciunie, J., Monastra, F.M., Carra, S., Vitale, G., Mantecca, P., Cotelli, F., Gaudenzi, G.
- Source
- Full text @ J. Neurosci. Res.
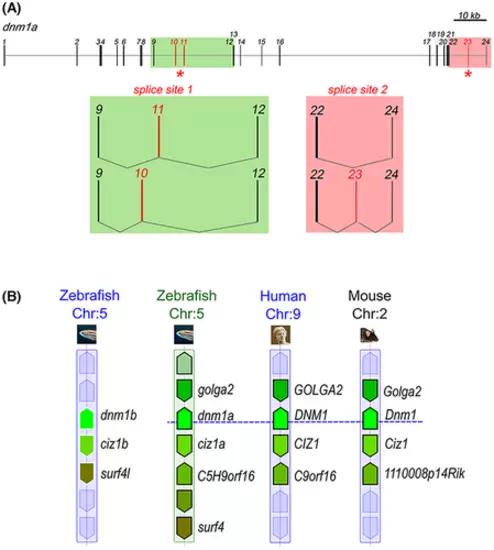
dnm1a synteny and alternative splicing sites. (A) Genomic organization and transcript variants of dnm1a. In the schematics of dnm1a, exons were numbered and indicated by boxes, while introns were indicated by solid lines. Red boxes indicated alternative spliced exons. Areas containing sites of alternative splicing were highlighted in green and red. Observed events of alternative splicing were represented showing retained exons at each splice site. (B) Synteny map comparing flanking regions of dnm1 loci among zebrafish, mouse and human chromosomes (chr) was obtained through the Genomicus Phyloview browser. Genes annotated as paralogs (no surrounding line) or orthologs (with a black surrounding line) by the Ensembl database shared the same color. Syntenic genes was detected in flanking regions of both dnm1a and dnm1b, suggesting they are co-orthologs of mammalian single copies. However, genomic context of dnm1a is more similar to human DMN1 and murine Dnm1 flanking regions than dnm1b. |
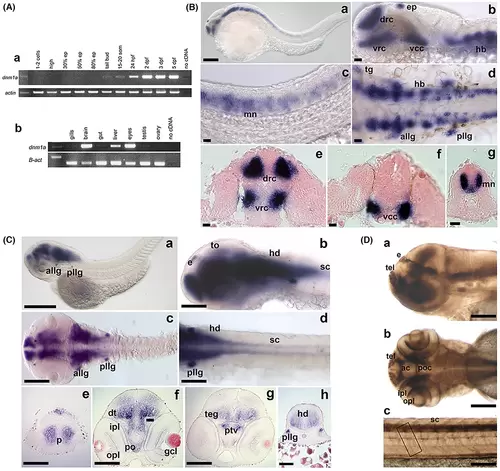
Panel A. dnm1a spatio-temporal expression. RT-PCR assays using total RNAs extracted from embryos at different embryonic and larval stages (ranging from the first cleavage stages to early larval period) and from different adult organs were performed. (a) During embryo development, dnm1a mRNA was identified starting from the tail bud stage (10 hpf, hours postfertilization) through 5 dpf. Scale bar 250 μm. (b) In the adult, zebrafish dnm1a transcript was detected in the brain, eyes, and liver. Scale bar 250 μm. (c–g) Scale bar 250 μm. Panels B and C. dnm1a spatial expression pattern during zebrafish embryonic development. (B, a, e and f) At 24 hpf dnm1a transcript was localized in the epiphysis and in three large bilateral clusters in anterior telencephalon (dorso rostral cluster, drc) and on the floor of the diencephalon (ventro rostral cluster, vrc) and mesencephalon (ventro caudal cluster, vcc). (B, b–d and g) Strong signals were detected in the hindbrain and in the spinal cord. (B, c and g) Transverse histological sections of 24 hpf stained embryos at trunk level revealed that dnm1a was expressed in the medio-ventral portion of the spinal cord, corresponding to the area of developing motor neuron nuclei (mn). (B, d) At 24 hpf dnm1a transcript is present in six bilateral spots, corresponding to the anterior and posterior lateral line (allg and pllg) and trigeminal ganglia (tg). During later stages, dnm1a expression is visible in the cephalic regions of the CNS and in the ganglia-like structures. Scale bar 100 μm. (C, b and d) Starting from 2 dpf a hybridization signal in the spinal cord was detected only after an extended staining reaction time (sc). (C, e–h) Telencephalon transverse histological sections of 2 and 5 dpf larvae showed dnm1a expressing cells localized in the pallium area (p). (C, f) dnm1a is present in the preoptic area (po), and in the hypothalamus. (C, g and f) A strong signal is present in two areas corresponding to the ventral part of the posterior tuberculum (ptv) and to the dorsal thalamus (dt). (C, g) dnm1a expressing cells are visible in the mesencephalon tegmentum (teg). (C, b) dnm1a presented a slight expression in the optic tectum (to). (C, h) dnm1a signal is present in the hindbrain (hd). Panel D. Dnm1a protein localization during embryonic development. (a and b) Immunopositive spots, corresponding to developing glomeruli, in the telencephalon (tel), were observed in embryos at the developmental stage of 3 days postfertilization. Dnm1a signal is present in the hindbrain and in the spinal cord, localized in the anterior and postoptic commissures (ac and poc). (b) At 3 dpf, an increase in Dnm1a signal was observed in the retina (IPL and OPL). (c) A faint signal was detected in motor neuron axons and in cephalic structures similar to ganglia. Scale bar 250 μm. EXPRESSION / LABELING:
|
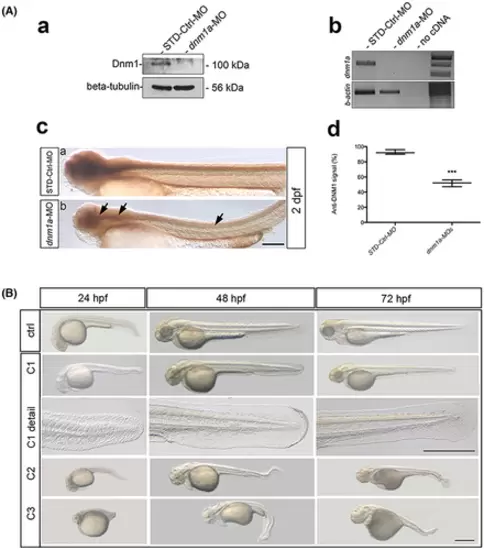
Panel A. dnm1a downregulation efficiency. (a) Western blot shows reduced Dnm1a (100 kDa) expression level in MO-injected embryos, with β-tubulin (56 kDa) as internal control. (b) RT-PCR agarose gel shows dnm1a EXPRESSION / LABELING:
PHENOTYPE:
|

Panel A. Neurite formation in dnm1a-MO-injected embryos. (A) The neurite formation on 3 dpf morphants pertaining to the C1 class was observed after acetylated tubulin staining. (a and b) Morphants at 3 dpf were compared to control embryos. In dnm1a-Mos-injected embryos, different defects in the pathfinding of motor neuron axons were observed. The morphants showed a straight ventral trajectory of CaP axons (78% of injected embryos, n = 42) compared to control embryos (n = 40). Fewer morphants (14.3% of injected embryos, n = 42) showed axons that stopped to elongate (asterisk), and an atypical curve of the terminal portion (arrowhead). Scale bar 100 μm. Panel B. Presynaptic vesicles (SV2) and AChRs (α-BTX) in dnm1a-MO-injected embryos. (a–i) In order to visualize NMJs under a confocal microscope, morphants and control embryos were double-stained with SV2 and α-bungarotoxin. (i) The merged signal observed in morphants suggested that the axonal projections were associated correctly with the cluster of AChR. (d–f) The number of NMJs did not appear to be different in the two experimental groups. The distribution pattern of AChR and NMJs appeared slightly altered in morphants compared with controls. This was explained as a secondary effect of the strong muscular defects. Scale bar 100 μm. EXPRESSION / LABELING:
PHENOTYPE:
|

Morphants axial musculature development. The myoD expression pattern was analyzed after the dnm1a-MO microinjection. (A) At the developmental stage of 24 hpf, the distribution of myoD transcript was comparable between the dnm1a EXPRESSION / LABELING:
PHENOTYPE:
|

ZFIN is incorporating published figure images and captions as part of an ongoing project. Figures from some publications have not yet been curated, or are not available for display because of copyright restrictions. PHENOTYPE:
|