
|
Figure 2
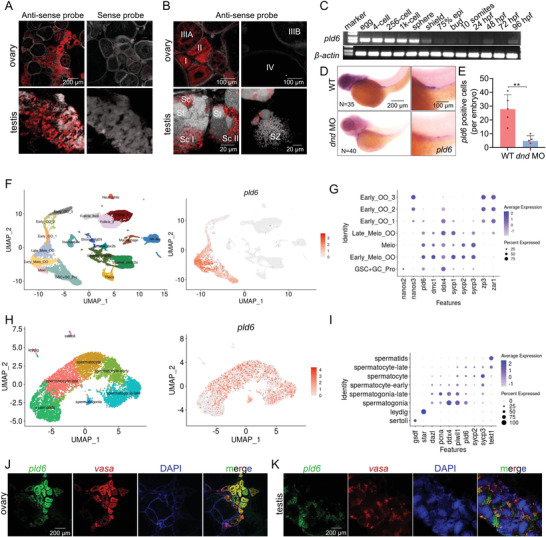
Specific expression of zebrafish pld6 in germline. A,B) In situ hybridization of ovary and testis cryosections with pld6 probe. Scale bar: 200 µm for A; 100 µm for B up; 20 µm for B down. C) Expression detection of pld6 in early embryonic stage by RT‐PCR. D) Expression detection of pld6 in wildtype and dnd‐knockdown 3 dpf embryos by WISH. N represents analyzed embryo number. E) Statistical analysis of pld6‐positive cells in wildtype and dnd‐knockdown 3 dpf embryos in panel D. F) The exhibition of 19 cell types in the ovary at 40 dpf by UMAP (left). The distribution of pld6‐expressed cells (right). G) Expression of ten marker genes (nanos2, nanos3, pld6, dmc1, ddx4, sycp1, sycp2, sycp3, zp3, and zar1) in the germ cells at different stages. H) The exhibition of 8 cell types in the adult testis by UMAP (left). The distribution of pld6‐expressed cells (right). I) Expression of ten marker genes (gsdf, star, dazl, pcna, ddx4, piwil1, sycp2, sycp3 and tekt1) in the somatic cells and germ cells at different stages. J) Two‐color fluorescent in situ hybridization of adult ovary with probes of pld6 and vasa. Scale bar: 200 µm. K) Two‐color fluorescent in situ hybridization of adult testis with probes of pld6 and vasa. Scale bar: 200 µm. The data were expressed as mean ± SD. The P values in this figure were calculated by two‐sided t‐test. **P < 0.01; MO, morpholino; WISH, whole‐mount in situ hybridization; dpf, days post fertilization.