
|
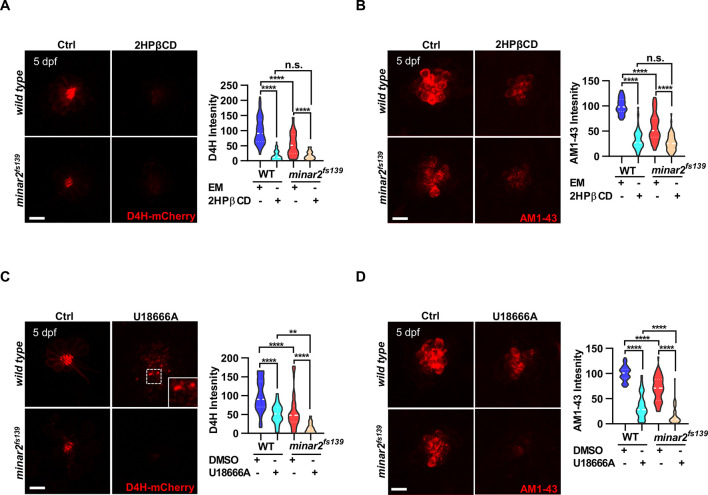
Figure 5
(A) Quantification of D4H-mCherry intensity in wild type and mutant minar2fs139 larvae after 2HPβCD treatment. The lateral line L3 neuromast was imaged and quantified. n=45, 41, 52, and 51. F(3, 110.2)=74.76, p<0.0001. (B) Quantification of AM1-43 labeling in wild type and mutant minar2fs139 larvae after 2HPβCD treatment. n=49, 46, 49, and 51. F(3, 155.4)=124.4, p<0.0001. (C) Quantification of D4H-mCherry intensity in wild type and mutant minar2fs139 larvae after U18666A treatment. n=40, 31, 42, and 33. F(3, 111.3)=39.34, p<0.0001. (D) Quantification of AM1-43 labeling in wild type and mutant minar2fs139 larvae after U18666A treatment. n=53, 50, 52, and 46. F(3, 169.9)=158.0, p<0.0001. EM: embryonic medium, solvent control groups for 2HPβCD treatment (A and B); DMSO: solvent control groups for U18666A treatment (C and D); Multiple comparison significance values are indicated on the graph. Scale bars represent 10 μm.
Lowering cholesterol levels aggravates hair cell defects in minar2 mutants.