IMAGE

Figure 2

ID
ZDB-IMAGE-220801-78
Source
Figures for Glasco et al., 2022
Image
Figure Caption

Figure 2

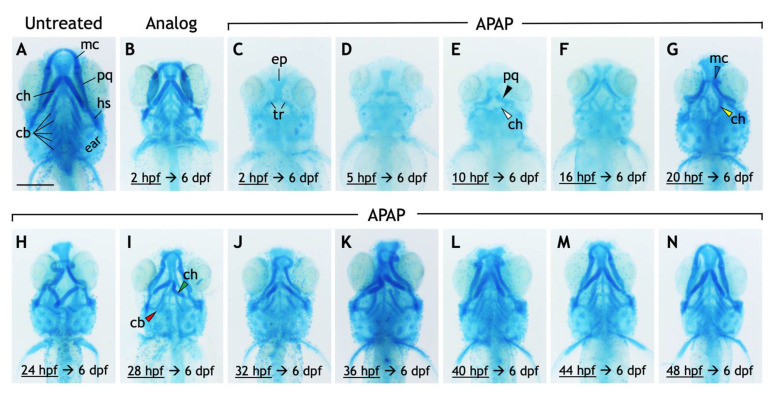
Exposure to acetaminophen, but not a non-hepatoxic analog, disrupts the development and morphology of craniofacial cartilages. (AN) Ventral views of 6-dpf larvae stained with alcian blue. Compared to untreated larvae (A), those treated continuously with 3-acetamidophenol (3.9 mM), a non-hepatotoxic acetaminophen analog (B), have a reduced body size but with all craniofacial cartilages intact. (CN) APAP treatment (3.9 mM) was initiated at the timepoints indicated then continuously through 6 dpf. The effects on the cartilages of the viscerocranium (labeled in (A)), in both their presence and morphology, are generally less severe as the initiation of treatment is delayed (CN). In a larva treated with APAP from 2 hpf (C), all cartilages of the viscerocranium are missing, making visible cartilages of the neurocranium, most prominently the ethmoid plate (ep) and the bilateral trabeculae (tr). These cartilages were clearly visible in all larvae in all treatment groups. Incrementally delaying treatment results in the restoration of cartilages derived from the first and second pharyngeal arches (e.g., Meckel’s cartilage) earliest, followed by cartilages derived from the third through seventh pharyngeal arches (ceratobranchial cartilages). With treatment delayed to 10 hpf, the palatoquadrate (pq) and ventral ceratohyal (ch) cartilages are more frequently present (black and white arrowheads in E, respectively). When treatment is delayed to at least 20 hpf, the ventral ceratohyal cartilages tend to be oriented posteriorly rather than anteriorly (compare yellow arrowhead in (G) with morphology in (A)), and Meckel’s cartilage (mc) becomes more frequent (blue arrowhead in (G)) though misshapen. The ventral ceratohyal cartilages also begin to be oriented anteriorly (green arrowhead in (I)). Treatment at 28 hpf restores a reduced number of ceratobranchial cartilages in most larvae (red arrowhead in (I)), though they can appear as early as with a 24 hpf treatment. One representative larva is shown from each treatment group, though the effects vary within each treatment group. Scale bar (in (A)) for (AN), 250 µm.

Figure Data
Acknowledgments
This image is the copyrighted work of the attributed author or publisher, and ZFIN has permission only to display this image to its users. Additional permissions should be obtained from the applicable author or publisher of the image. Full text @ J Dev Biol