
|
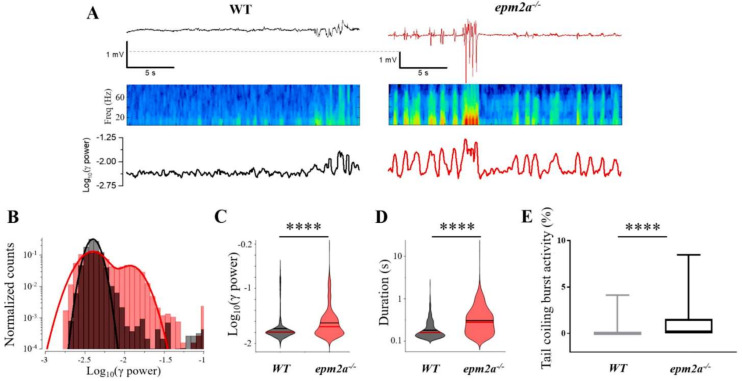
Fig. 4
LFP and burst activity recordings in epm2a−/− zebrafish mutants. (A) (Top) Snapshot of 25 s–long extract of LFP signal recorded from 120 hpf WT (left) and epm2a−/− (right) zebrafish showing differences in burst activity. The relative spectrogram (Middle) and power in the 30–95 Hz band computed on a rolling window of 250 ms in steps of 50 ms (Bottom) are also shown. (B) Distribution of the log10 of the power in the 30–95 Hz band from the complete recordings (15 min) of the larvae depicted in panels A and B (WT in black and epm2a−/− in red). (C) and (D) Violin plots of the power and duration of the events detected from all the WT (n = 11) and epm2a−/− (n = 11) fish. Red and black lines indicate medians and means, respectively. (E) Coiling frequency recorded for 60 s at 30 hpf is increased in epm2a−/− embryos (n = 157) with respect to WT controls (n = 174). ****: p ≤ 0.0001 calculated by Mann-Whitney test.