
|
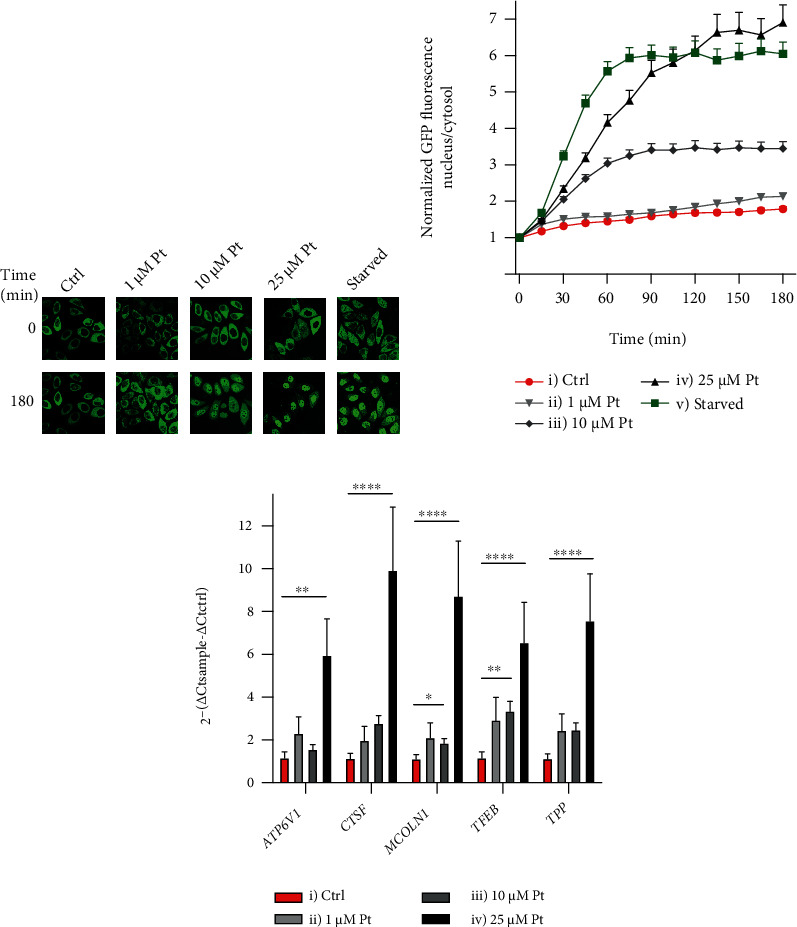
Figure 1 Pt induces translocation and activation of TFEB in HeLa cells. TFEB migration kinetics: (a) representative images of HeLa cells overexpressing TFEB-GFP, treated as indicated, and (b) plot of the nucleus/cytosol green fluorescence ratios after the indicated additions or medium exchange at time zero.Mean values + SEM; N ≥ 55 cells for each time point and condition, observed in at least 3 separate experiments. Comparison with Ctrl: p < 0.0001 rom 15 min for curves (iii), (iv), and (v); p < 0.05 from 135 min for curve (ii). (c) Pt enhances the transcription of TFEB and its target genes. Mean values + SEM; N ≥ 5. Horizontal bar extremities correspond to the columns to be compared.