
|
FIGURE 7
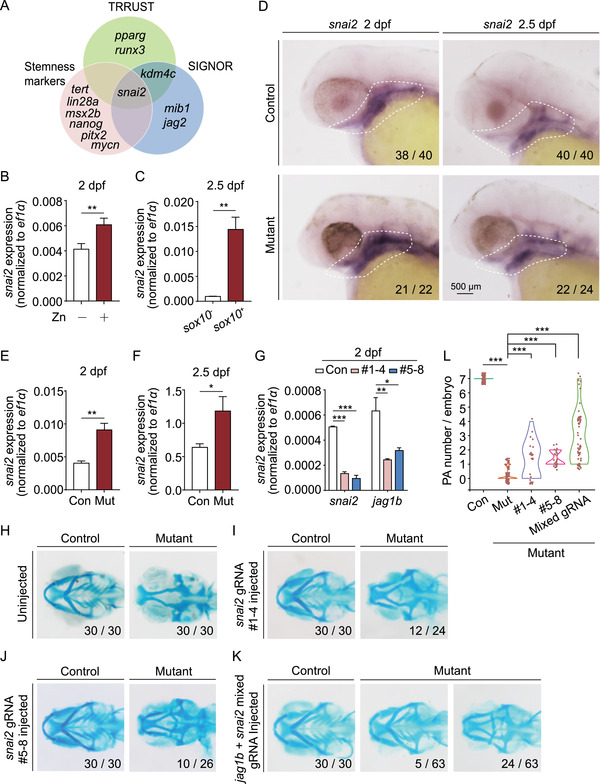
Snai2 is the upstream regulator of jag1b. (A) Venn diagram summarizing the overlap among genes determined by cross‐referencing the Transcriptional Regulatory Relationships Unraveled by Sentence‐based Text‐mining (TRRUST) database, SIGnaling Network Open Resource (SIGNOR) database, and stemness markers analyzed using SMART‐seq. (B) Summary of snai2 mRNA measured in sox10 + cells isolated from control embryos and control embryos exposed to 1 mM zinc. (C) Summary of snai2 mRNA measured in sox10 ‒ and sox10 + cells isolated from Tg(sox10:kikGR) embryos. (D) in situ hybridization of snai2 in control and mutant embryos at 2 and 2.5 dpf. (E and F) Summary of snai2 mRNA measured in sox10 + cells isolated from control and mutant embryos at 2 dpf (E) and 2.5 dpf (F). (G) Summary of snai2 mRNA and jag1b mRNA measured in wild‐type embryos and wild‐type embryos injected with two different sets of snai2 CRISPR/Cas9 ribonucleoprotein complexes. (H–K) Representative images of cartilage staining of control and mutant embryos. Where indicated, the embryos were injected with the snai2 CRISPR/Cas9 ribonucleoprotein complexes (I and J) or both the snai2 and jag1b CRISPR/Cas9 ribonucleoprotein complexes (K). Examples of two distinct mutant phenotypes, with the corresponding frequencies, are shown in panel (K). (L) Violin plot summarizing the number of PA pairs/embryos in control embryos and mutant embryos injected with the snai2 CRISPR/Cas9 ribonucleoprotein complexes alone or together with the jag1b CRISPR/Cas9 ribonucleoprotein complexes (mixed gRNA). *p < 0.05, **p < 0.01, and ***p < 0.001