IMAGE

Fig. 4.

ID
ZDB-IMAGE-210802-8
Source
Figures for Gilbert et al., 2021
Image
Figure Caption

Fig. 4.

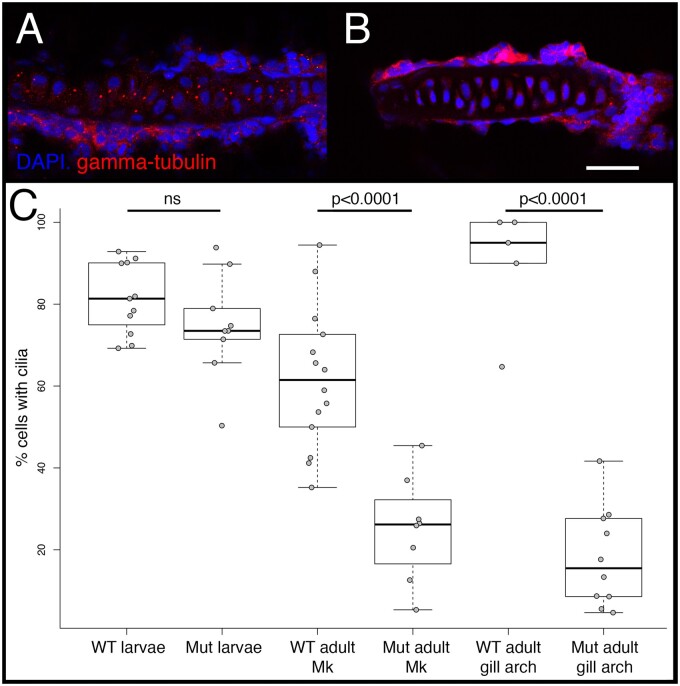
Cilia number in WT and mutant zebrafish. Cilia were visualized via immunohistochemistry using either anti-gamma-tubulin (shown), which labels the basal bodies, or anti-alpha acetylated-tubulin (not shown), which labels the axoneme, and imaged via confocal microscopy. Representative images are shown for the gill arch cartilage in WT (A) and full-sibling crooc2 mutants (B). Scale bar equals 20 µm. Quantification of cilia number per cartilage, calculated as the percentage of nondividing cells containing cilia, is shown in (C). Significance was determined via an ANOVA followed by a Tukey’s multiple comparison test. In larval (4dpf) fish, each data point represents a count from a different cartilage across n = 3 WT and n = 3 crocc2 mutant animals. In adults (>12 months), data points represent counts from different sections of Meckel’s cartilage (i.e., Mk), or from different gill arch cartilages. Sample sizes for adults are also n = 3 for each genotype.

Figure Data
Acknowledgments
This image is the copyrighted work of the attributed author or publisher, and ZFIN has permission only to display this image to its users. Additional permissions should be obtained from the applicable author or publisher of the image. Full text @ Mol Bio Evol