IMAGE

Figure 2

ID
ZDB-IMAGE-210711-2
Genes
Source
Figures for Serifi et al., 2021
Image
Figure Caption

Figure 2

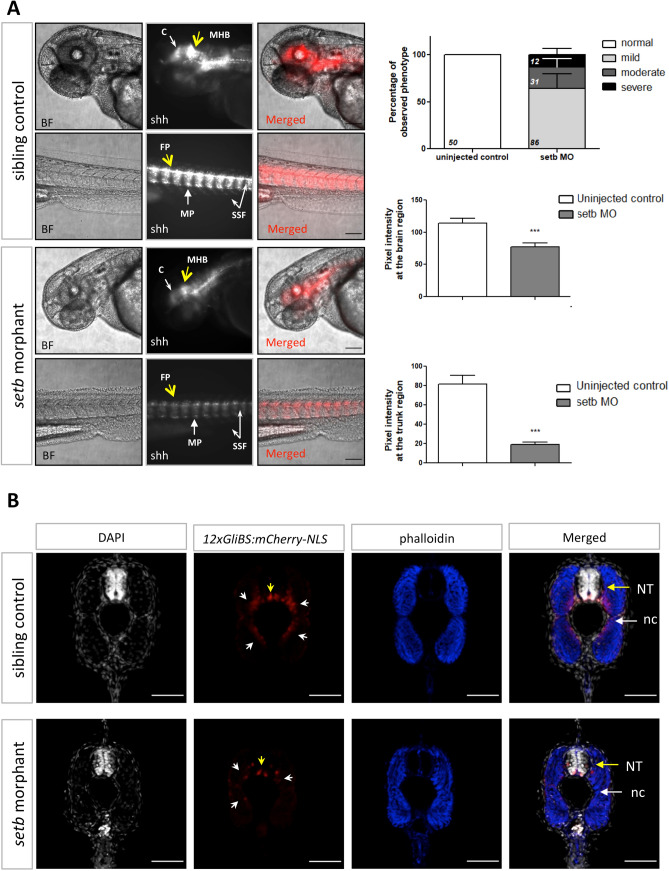
Activation of Hh signaling is reduced in setb morphants. (A) Fluorescent and brightfield images of 48 hpf setb-morpholino injected and control sibling Tg12x_Gli embryos. Embryos are placed anterior to left, dorsal up. Scale bars 100 μm. Quantification of pixel intensity at 48 hpf of the morphologically mildly affected embryos (***p < 0.001). Data are expressed as mean ± SEM (n = 129, after exclusion of the injected embryos developing apoptotic tissue at 24 hpf). Percentage of phenotypic scoring of 48 hpf morphants is presented with mean ± SEM and the numbers of total embryos per group is indicated. At the brain region: cerebellum (c, white arrow), mid-hindbrain boundary (MHB, yellow arrow). At the trunk region: floor plate (FP, yellow arrow), slow muscle pioneer cells (MP, white arrow, high mCherry signal), superficial slow fibers (SSF, white arrows, mid mCherry signal). (B) Confocal images of cross-sections throughout the trunk region of 48 hpf setb morphants and age-matched siblings. Note the reduction of mCherry+ cells at the ventral side of neural tube (yellow arrows) and at the slow fibers surrounding notochord (white arrows) of setb morphants; indication of lower activation levels of the Hh pathway. Sections were stained with phalloidin-633 (blue) and DAPI (grey). NT: neural tube, nc: notochord. Scale bars 50 μm.

Figure Data
Acknowledgments
This image is the copyrighted work of the attributed author or publisher, and ZFIN has permission only to display this image to its users. Additional permissions should be obtained from the applicable author or publisher of the image. Full text @ Sci. Rep.