IMAGE

Figure 6

ID
ZDB-IMAGE-210121-31
Genes
Antibodies
Source
Figures for Feng et al., 2020
Image
Figure Caption

Figure 6

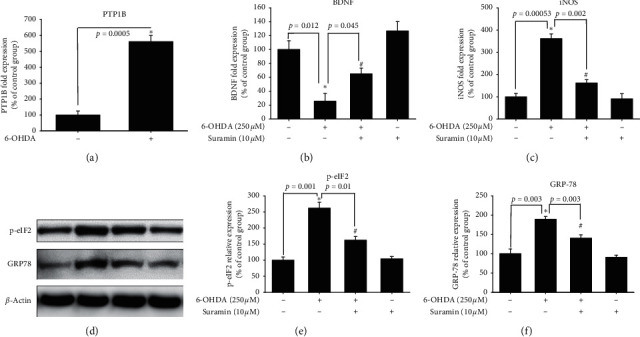
Neuroprotective effect of suramin on the 6-OHDA-induced zebrafish PD model. (a) Zebrafish were pretreated with 10 μM suramin from 9 h after fertilization (hpf) to 3 days after fertilization (dpf) and then challenged with 250 µM 6-OHDA from 2 to 3 dpf. Quantitative PCR of PTP1B for the control and 6-OHDA groups was performed. (b) Zebrafish were pretreated with 10 μM suramin from 9 hpf to 3 dpf and then challenged with 250 µM 6-OHDA from 2 to 3 dpf. Quantitative PCR of BDNF for the control, 6-OHDA, 6-OHDA plus suramin, and suramin alone groups was performed. (c) Zebrafish were pretreated with 10 μM suramin from 9 hpf to 3 dpf and then challenged with 250 µM 6-OHDA from 2 to 3 dpf. Quantitative PCR of iNOS for the control, 6-OHDA, 6-OHDA plus suramin, and suramin alone groups was performed. (d) Zebrafish were pretreated with 10 μM suramin from 9 hpf to 5 dpf and then challenged with 250 µM 6-OHDA from 2 to 5 dpf. Western blotting of p-eIF2 and GRP-78 for the control, 6-OHDA, 6-OHDA plus suramin, and suramin alone groups was performed. (e) Quantitative results of p-eIF2 protein expression. (f) Quantitative result of GRP-78 protein expression. Data are presented as mean ± SEM, and each value contains three replicates and three samples. Significantly different from the control; #significantly different from the 6-OHDA group.

Figure Data
Acknowledgments
This image is the copyrighted work of the attributed author or publisher, and ZFIN has permission only to display this image to its users. Additional permissions should be obtained from the applicable author or publisher of the image. Full text @ Parkinsons Dis