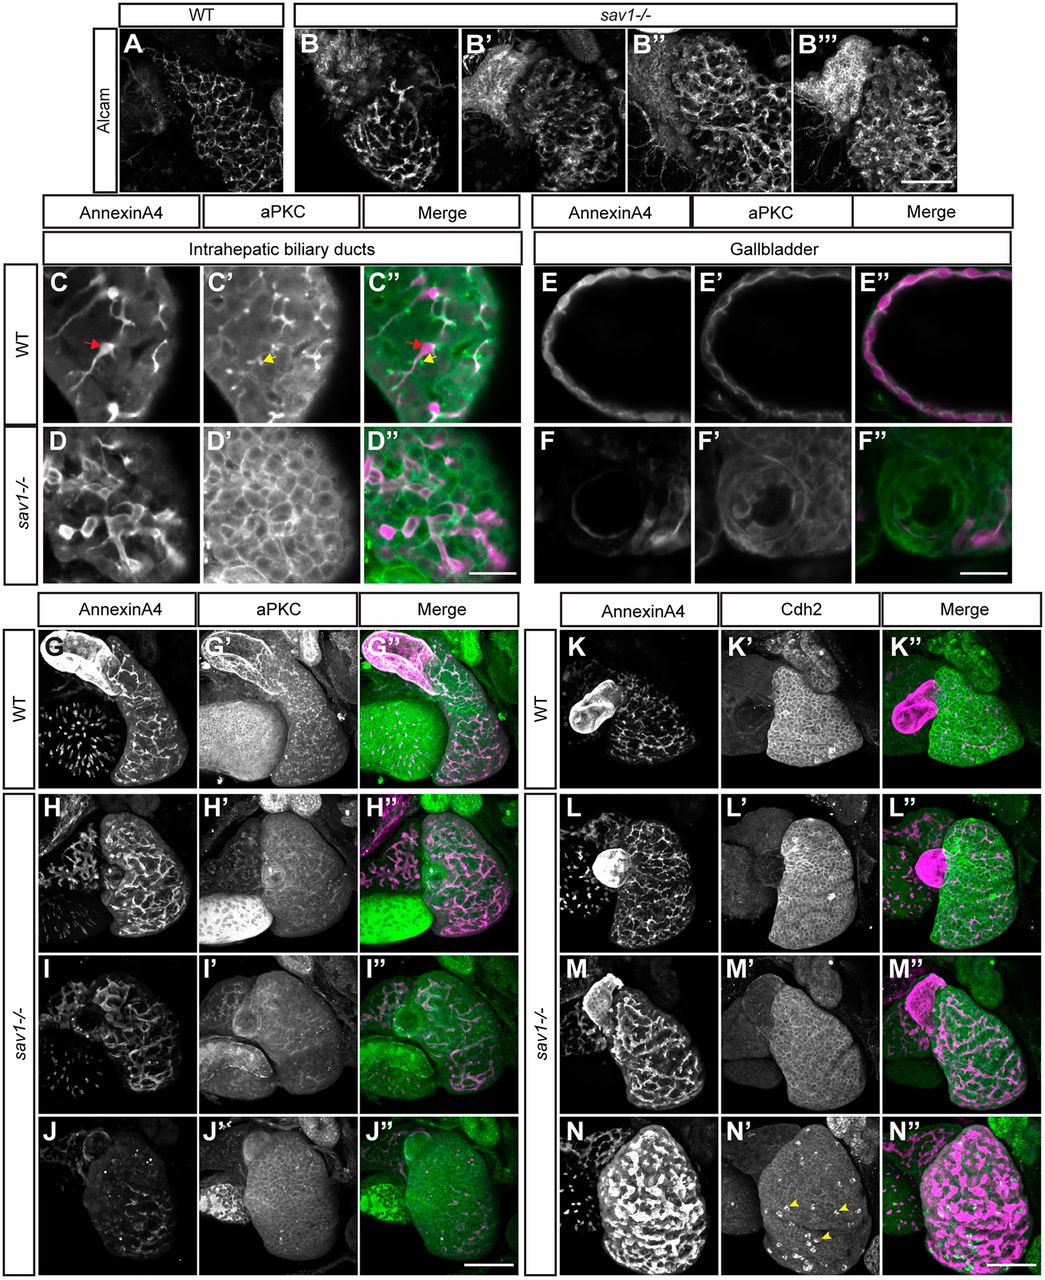
Fig. 7 Hepatocyte apical domains appear abnormal and expanded in sav1−/− larvae. (A-B‴) Examples of wild-type (A) and sav1−/− (B-B‴) 8 dpf larvae whole-mount immunostaining for Alcam. n=5 wild type, n=6 sav1−/−. Scale bar: 100 μm. (C,D) Single plane images of intrahepatic biliary ducts stained for annexin A4 in wild-type and sav1−/− 8 dpf larvae respectively. Red arrow in C indicates one annexin A4+ biliary epithelial cell. (C′,D′) Single plane images of aPKC staining in wild-type and sav1−/− 8 dpf larvae, respectively. Yellow arrow in C′ indicates one canaliculus. (C″,D″) Merged images with green representing aPKC and magenta representing annexin A4. Scale bar: 25 μm. (E-F″) Examples of wild-type and sav1−/− gallbladder stained for aPKC and annexin A4, following the same labeling conventions as in C-D″. (G,G′) Z-projections of whole-mount staining for annexin A4 and aPKC in wild-type larvae at 8 dpf. Scale bar: 25 μm. (H,H′,I,I′,J,J′) Z-projections of whole-mount staining for annexin A4 and aPKC in sav1−/− larvae at 8 dpf. (G″,H″,I″,J″) Merged images with green representing aPKC and magenta representing annexin A4 (n=7 wild type; n=5 sav1−/−). Scale bar: 100 μm. (K-K″) Z-projections of whole-mount staining for annexin A4 and Cdh2 in wild-type larvae at 8 dpf. (L,L′,M,M′,N,N′) Z-projections of whole-mount staining for annexin A4 and Cdh2 in sav1−/− larvae at 8 dpf. Yellow arrowheads in N′ indicate examples of high intensity cytoplasmic punctate Cdh2 staining, suggesting cadherin junction collapse. (L″,M″,N″) Merged images of Cdh2 (green) and annexin A4 (magenta) (n=7 wild type; n=6 sav1−/−). Scale bar: 100 μm.
Image
Figure Caption
Figure Data
Acknowledgments
This image is the copyrighted work of the attributed author or publisher, and
ZFIN has permission only to display this image to its users.
Additional permissions should be obtained from the applicable author or publisher of the image.
Full text @ Development

