IMAGE

Fig 6

ID
ZDB-IMAGE-200724-15
Source
Figures for Jiang et al., 2020
Image
Figure Caption

Fig 6 Heatmaps of DE genes.

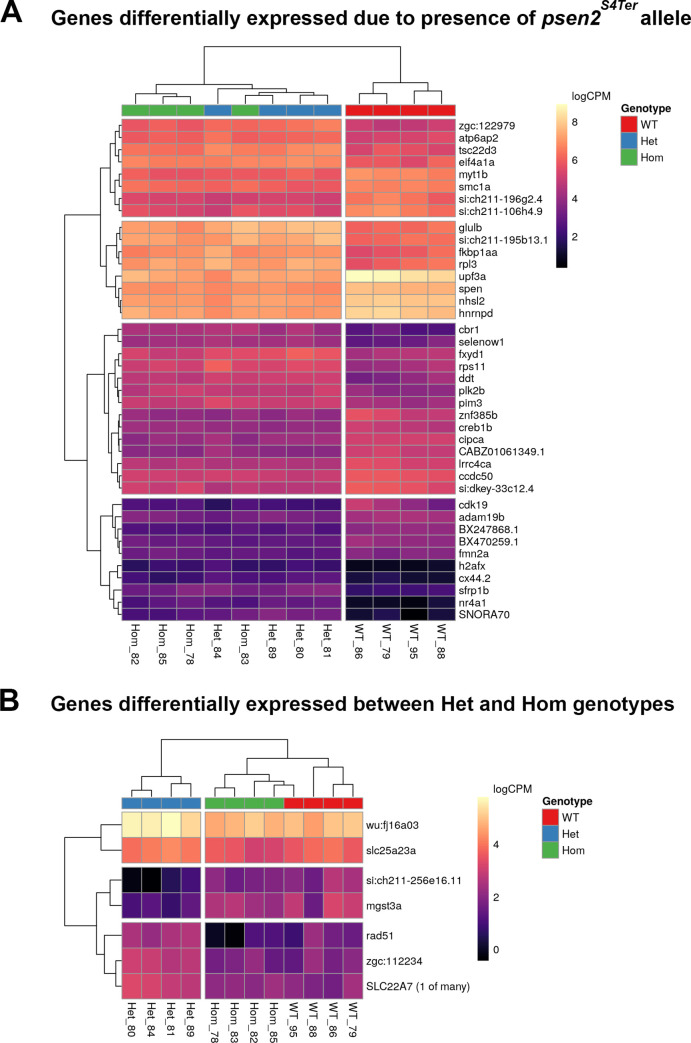
Plotted values are logCPM based on CQN-normalized counts. (A) The most highly ranked 40 (of the 615) DE genes by FDR identified when comparing WT fish to genotypes possessing the psen2S4Ter allele. (B) The 7 most highly-ranked genes (FDR < 0.05) which were detected as DE between Het and Hom mutant genotypes. Unique sample name identifiers are given beneath each column.

Acknowledgments
This image is the copyrighted work of the attributed author or publisher, and ZFIN has permission only to display this image to its users. Additional permissions should be obtained from the applicable author or publisher of the image. Full text @ PLoS One