IMAGE

Fig 4

ID
ZDB-IMAGE-191230-1192
Source
Figures for Green et al., 2019
Image
Figure Caption

Fig 4 Heterotypic interactions between phagocytic cells alters emigration.

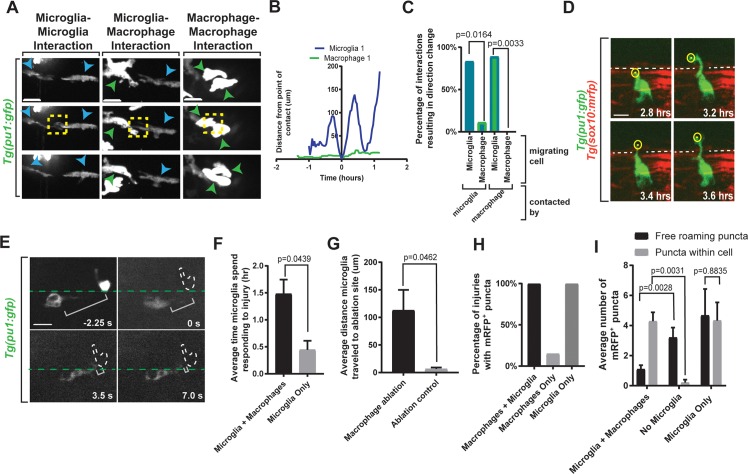
(A) Images from 24-hour time-lapse movies starting at 4 dpf in Tg(pu1:gfp);Tg(sox10:mrfp) zebrafish showing points of cell–cell contact. Blue arrowheads indicate microglia. Green arrowheads indicate macrophages. Yellow box indicates contact. (B) Quantification of distance traveled pre- and post-contact between a microglia and macrophage. (C) Quantification of percentage of cells experiencing directional change post-contact with migrating cell (p = 0.0164; p = 0.0033). (D) Images from a 24-hour time-lapse movie starting at 4 dpf in Tg(pu1:gfp);Tg(sox10:mrfp) zebrafish showing microglia extending a cellular process into the periphery. Dashed line indicates sox10+ boundary. Yellow circle indicates tip of cellular projection. (E) Images from a time-lapse ablation window in Tg(pu1:gfp) zebrafish at 4 dpf showing successful ablation of macrophage and immediate microglial response. Green dashed line indicates spinal cord boundary. Bracket indicates distance between microglia and ablated macrophage. (F) Quantification of average time microglia spent responding to injury. (G) Quantification of average distance microglia traveled to the macrophage or control ablation site (p = 0.0462). (H) Quantification of percentage of injuries containing sox10+ puncta. (I) Quantification of number of free-roaming debris puncta compared to puncta localized within cells. Scale bar equals 10 μm (A, D, and E). Statistics summarized in S1 Table. See S4 Data for raw data. dpf, days post fertilization.

Acknowledgments
This image is the copyrighted work of the attributed author or publisher, and ZFIN has permission only to display this image to its users. Additional permissions should be obtained from the applicable author or publisher of the image. Full text @ PLoS Biol.