IMAGE

Fig 3

ID
ZDB-IMAGE-191230-1191
Source
Figures for Green et al., 2019
Image
Figure Caption

Fig 3 Glutamate-NMDA induces migration of microglia to the PNS.

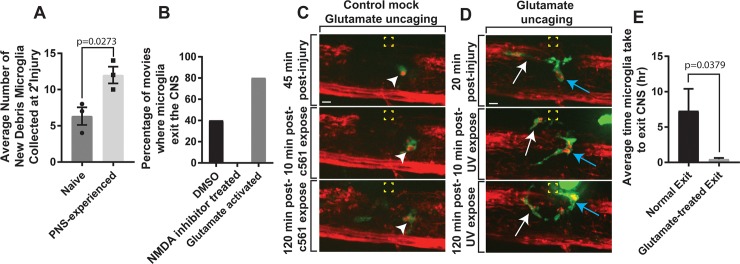
(A) Quantification of the average number of new debris from PNS-primed microglia collected at the secondary injury site compared to naïve CNS microglia (p = 0.0273). (B) Quantification of the percentage of movies in which microglia exit the CNS in DMSO, NMDA inhibitor treated, and glutamate uncaged in PNS cases. (C) Images from 24-hour time-lapse movies starting at 4 dpf in Tg(pu1:gfp);Tg(sox10:mrfp) MNI-L-glutamate treated zebrafish showing the response of microglia pre- and post-mock glutamate uncaging. Arrowheads denote microglia. Yellow box indicates uncaging site. (D) Images from 24-hour time-lapse movies starting at 4 dpf in Tg(pu1:gfp);Tg(sox10:mrfp) MNI-L-glutamate treated zebrafish showing the response and ectopic migration of microglia pre- and post-glutamate uncaging. White arrow denotes first microglia; blue arrow indicates a second microglia. Yellow box indicates uncaging site. (E) Quantification of the average time microglia took to exit the CNS post-glutamate uncaging (p = 0.0379). Scale bar equals 10 μm (C, D). Statistics summarized in S1 Table. See S3 Data for raw data. CNS, central nervous system; dpf, days post fertilization; MNI-L, 4-Methoxy-7-nitroindolinyl-caged-L-glutamate; NMDA, N-methyl-D-aspartate receptor; PNS, peripheral nervous system.

Acknowledgments
This image is the copyrighted work of the attributed author or publisher, and ZFIN has permission only to display this image to its users. Additional permissions should be obtained from the applicable author or publisher of the image. Full text @ PLoS Biol.