IMAGE

Fig 2

ID
ZDB-IMAGE-191230-1190
Source
Figures for Green et al., 2019
Image
Figure Caption

Fig 2 Microglia emigrate to the PNS and changes states following avulsion.

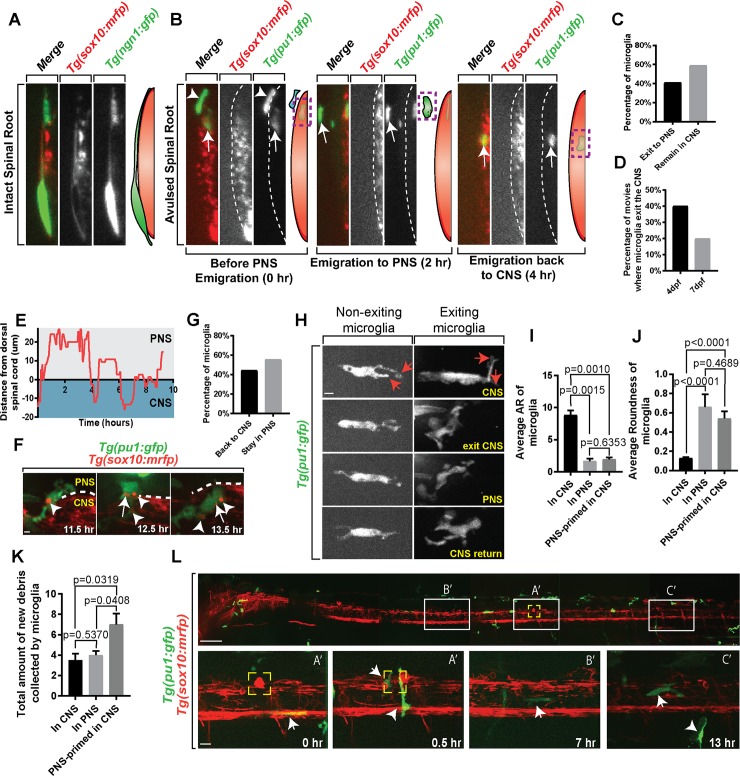
(A) Orthogonal rotation view of Tg(ngn1:gfp);Tg(sox10:mrfp) animals showing the proximity of the intact spinal root to the spinal cord. (B) Orthogonal rotation view of Tg(pu1:gfp);Tg(sox10:mrfp) animals showing microglia before PNS emigration, during emigration, and post-emigration back to the CNS. Arrows and green diagram color indicate microglia. Arrowheads and blue diagram color indicate macrophages. Dashed line indicates spinal cord boundary. (C) Quantification of the percentage of microglia that exit the CNS compared with those that remain in the CNS. (D) Quantification of the percentage of movies in which microglia exit the CNS at 4 dpf and 7 dpf. (E) Representative quantification of distance and time a microglia spent inside and outside of the CNS; y-axis > 0 indicates cell’s presence in PNS; y-axis < 0 indicates cell’s presence in CNS. (F) Images from a 24-hour time-lapse movie starting at 4 dpf in Tg(pu1:gfp);Tg(sox10:mrfp) zebrafish showing microglia picking up debris while in the PNS and re-enter the CNS. Arrowheads indicate debris puncta while in CNS. Arrows indicate debris puncta while in the PNS. (G) Quantification of percentage of ectopic microglia that come back into CNS after leaving to the PNS compared with those that stay in PNS in a 24-hour imaging window. (H) Images from a 24-hour time-lapse movie starting at 4 dpf in Tg(pu1:gfp);Tg(sox10:mrfp) zebrafish comparing the morphology of exiting and nonexiting microglia. Red arrows indicate projections created by microglia. (I) Shape description quantification of the average aspect ratio of microglia in the CNS, in the PNS, and PNS-primed in the CNS (p = 0.0010; p = 0.0015; p = 0.6353). (J) Shape description quantification of the average roundness of microglia in the CNS, in the PNS, and PNS-primed in the CNS (p < 0.0001; p < 0.0001; p = 0.4689). (K) Quantification of the total amount of new debris collected by microglia (p = 0.0319; p = 0.5370; p = 0.0408). (L) Stitched zoning images from a 24-hour time-lapse movie starting at 4 dpf in Tg(pu1:gfp);Tg(sox10:mrfp) zebrafish showing the entire animal. White boxes coordinated with letter tags represented zones of the animal in which microglia traveled; larger images located below. Yellow box indicates injury site. Arrows indicate microglia. Arrowheads indicate macrophages. Scale bar equals 1 μm (F,H), 10 μm (bottom L), and 100 μm (top L). Statistics summarized in S1 Table. See S2 Data for raw data. CNS, central nervous system; dpf, days post fertilization; PNS, peripheral nervous system.

Acknowledgments
This image is the copyrighted work of the attributed author or publisher, and ZFIN has permission only to display this image to its users. Additional permissions should be obtained from the applicable author or publisher of the image. Full text @ PLoS Biol.