
|
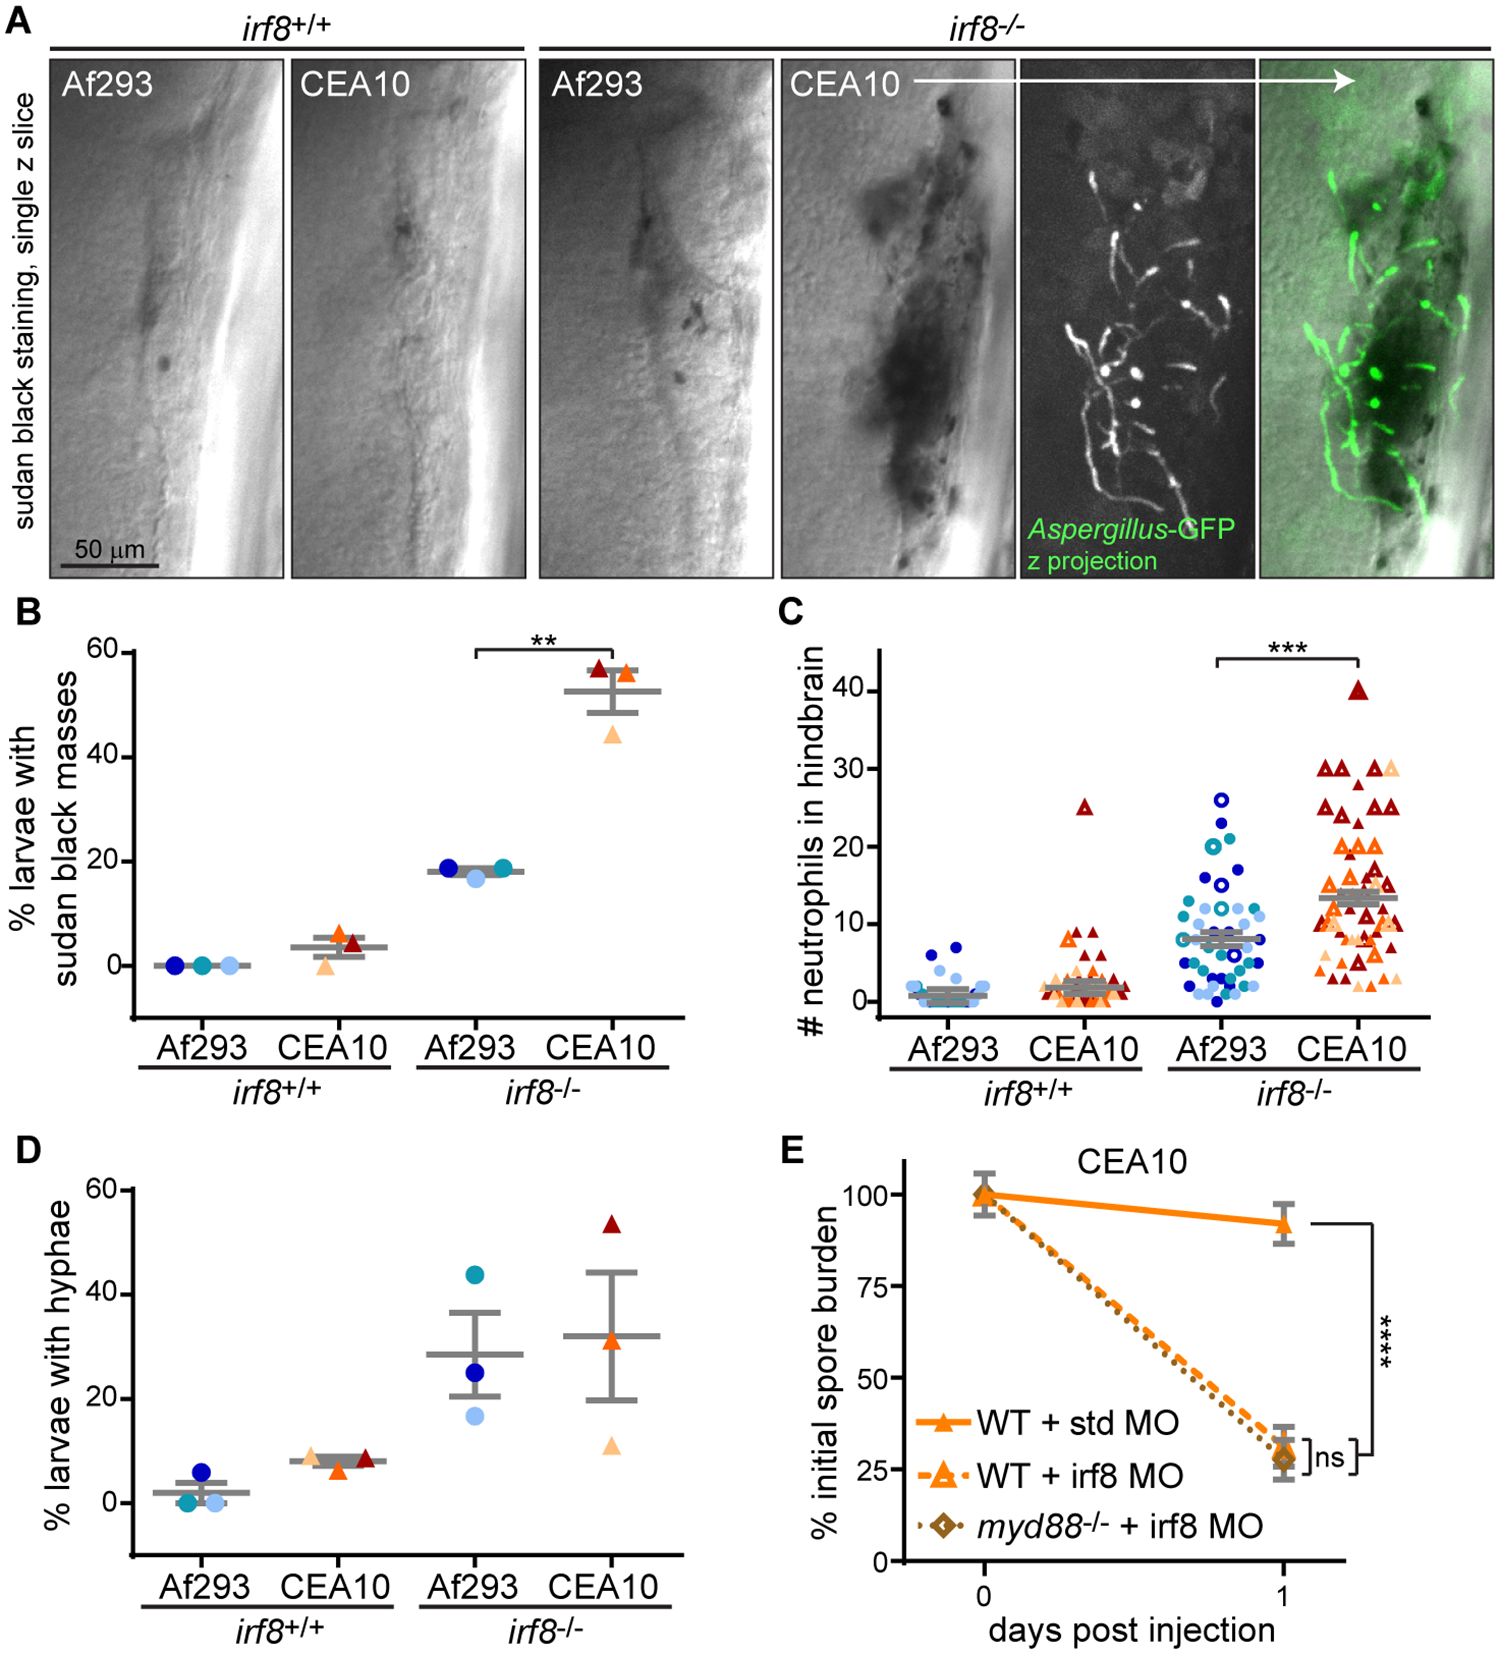
Fig. 7
More neutrophils are recruited to a CEA10-derived strain than an Af293-derived strain in the absence of macrophages.
A-D. Macrophage-deficient (irf8-/-) or control (irf8+/+) larvae were infected with YFP- or GFP-expressing A. fumigatus TBK1.1 (Af293) or TFYL49.1 (CEA10) strains, fixed 1 dpi, and stained for neutrophils (sudan black). Representative images are shown (A, scale bar represents 50 μm) and percent of larvae per experiment with sudan black masses (B), number of neutrophils at infection site (C), and percent of larvae per experiment with A. fumigatus hyphae (D) were quantified. N>9 larvae each condition each replicate. For percentage of larvae with sudan black masses or hyphae (B, D), each symbol represents one replicate, bars represent means ± SEM, P values calculated by t test. For neutrophil number quantification (C), each symbol represents one larvae. Larvae with sudan black masses where neutrophil numbers were difficult to count and represent underestimations are denoted with open symbols. Bars represent lsmeans ± SEM from 3 pooled replicates, P values calculated by ANOVA. All symbols are color-coded by replicate. E. Wild-type or myd88-/- embryos were injected with control (std) or macrophage-depleting (irf8) morpholinos. Larvae were then infected with TFYL49.1 (CEA10) spores and CFUs were measured. Average injection CFUs = 38. CFU data represent lsmeans ± SEM of 3 pooled replicates, n = 24 larvae (3 replicates, 8 larvae each) per condition per day, P values calculated with ANOVA. See also S7 Fig.