
|
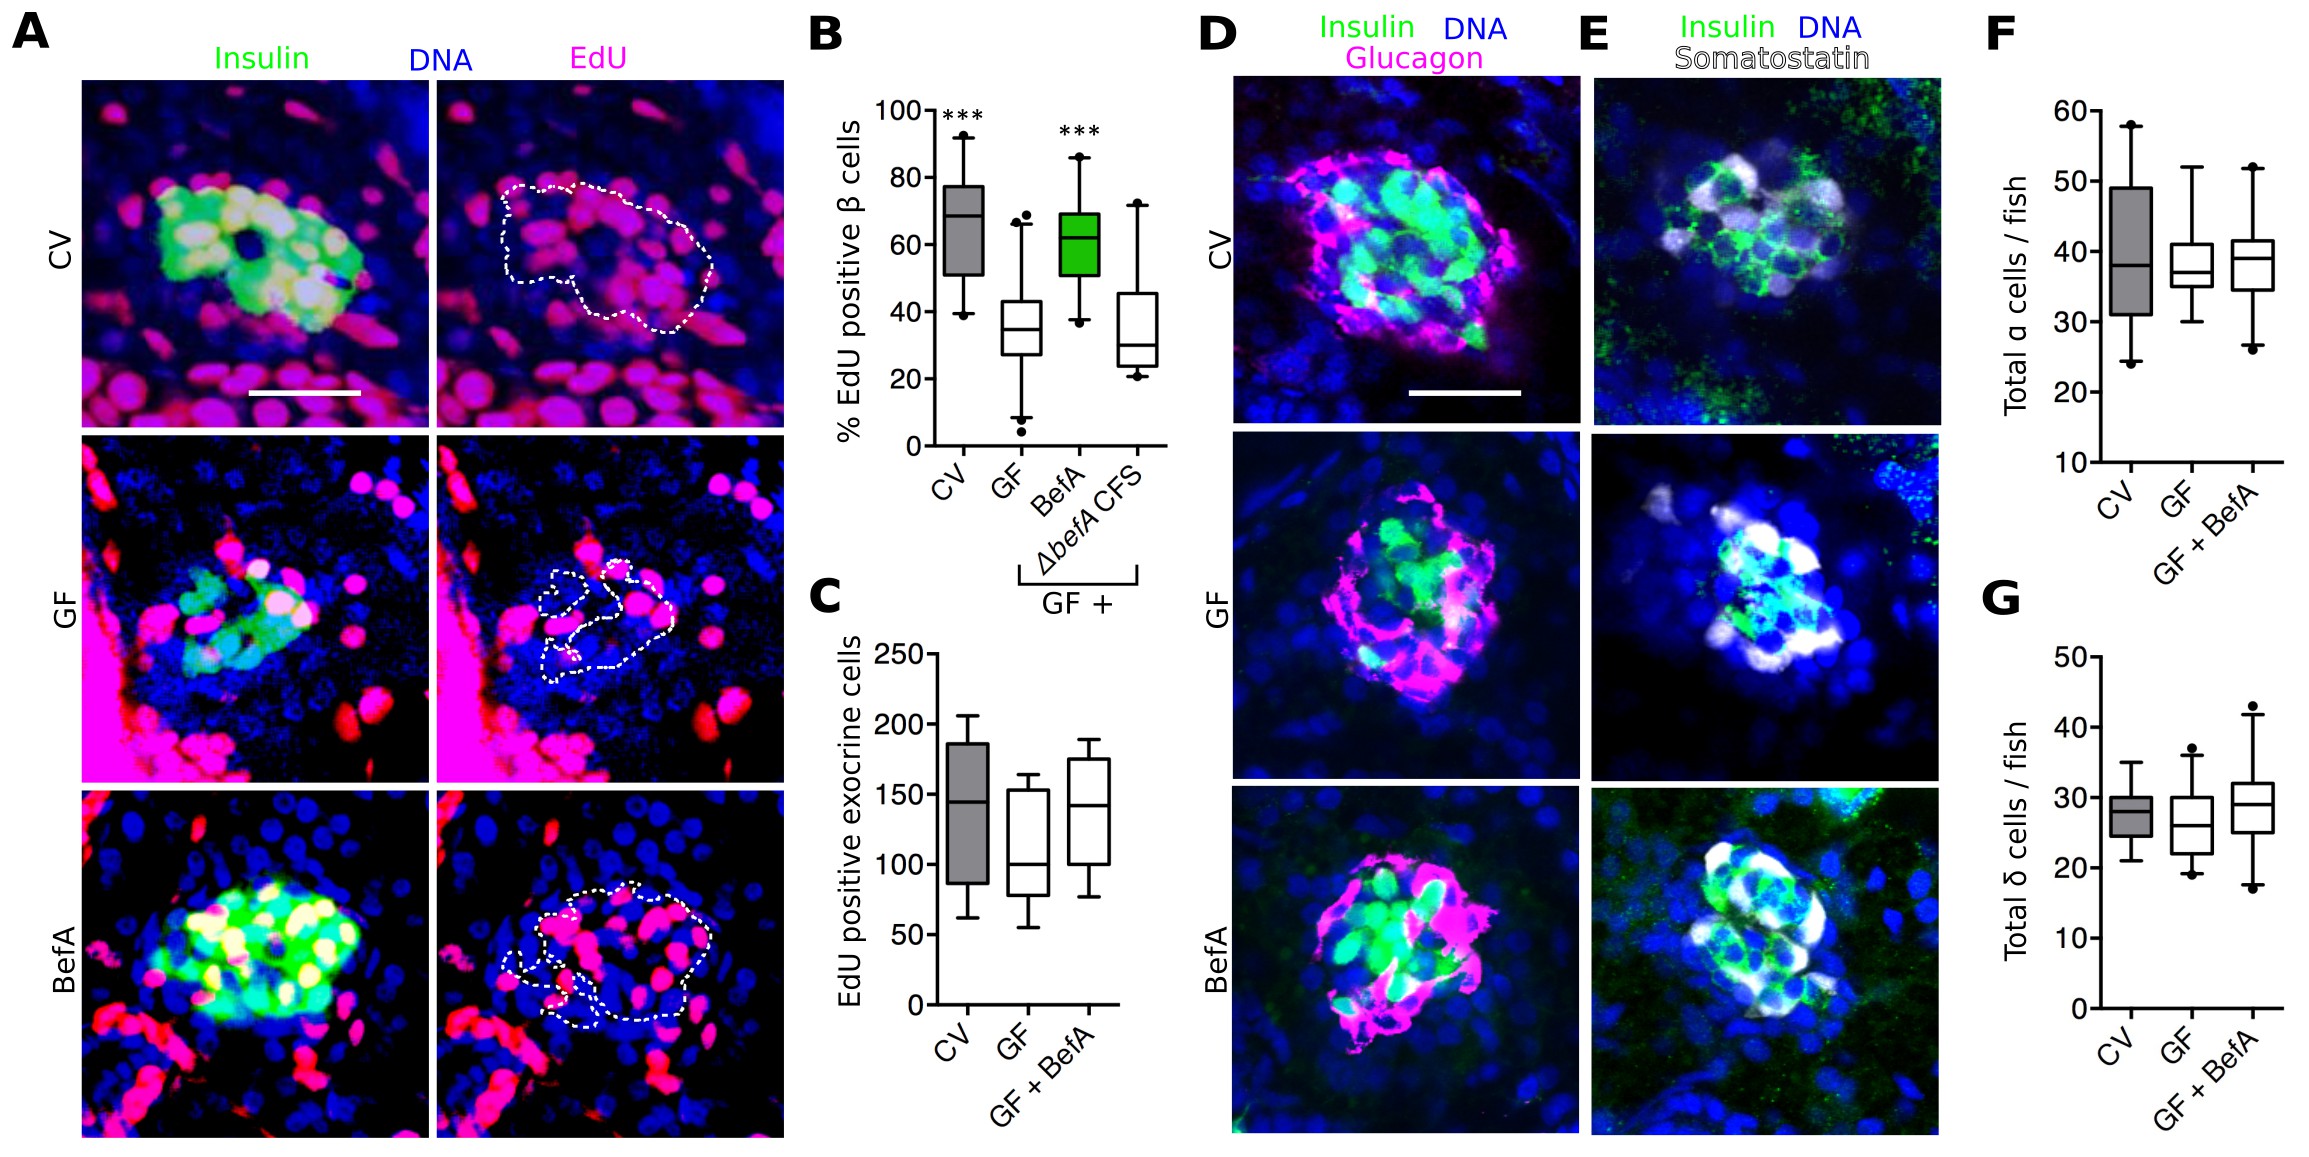
Fig. 5
BefA facilitates β cell mass expansion through proliferation.
(A, D & E) Representative 2D slices from confocal scans through the primary islets of GF, CV and BefA (10165) protein treated 6 dpf larvae. Scale bars = 40 μM. (A) Insulin promoter expressing β cells are shown in green, all nuclei are blue, and EdU containing nuclei are magenta. Left hand panels are a merge of all three markers. For ease of resolving cells that are double positive for both insulin and EdU, the right hand panels show the location of insulin outlined by white dashed lines. (B) Percentage of EdU positive β cells in CV, GF or GF treated with either purified BefA or CFS from A. veroniiΔbefA cultures (△befA CFS). ***p<0.001: Denotes treatment that is significantly different than GF by Tukey analysis. (C) Total EdU positive exocrine cells quantified from the approximate central longitudinal plane of the pancreas in each fish. (D) Insulin promoter expressing β cells are shown in green, all nuclei are blue, and α cells, stained with anti-glucagon antibody are magenta. (E) Somatostatin promoter expressing δ cells are shown in white, all nuclei are blue, and β cells stained with anti-insulin antibody are outlined in green. (F) Total α cells in GF, CV and GF fish treated with BefA. (G) Total δ cells in GF, CV and GF fish treated with BefA.