
Image
|
Figure Caption
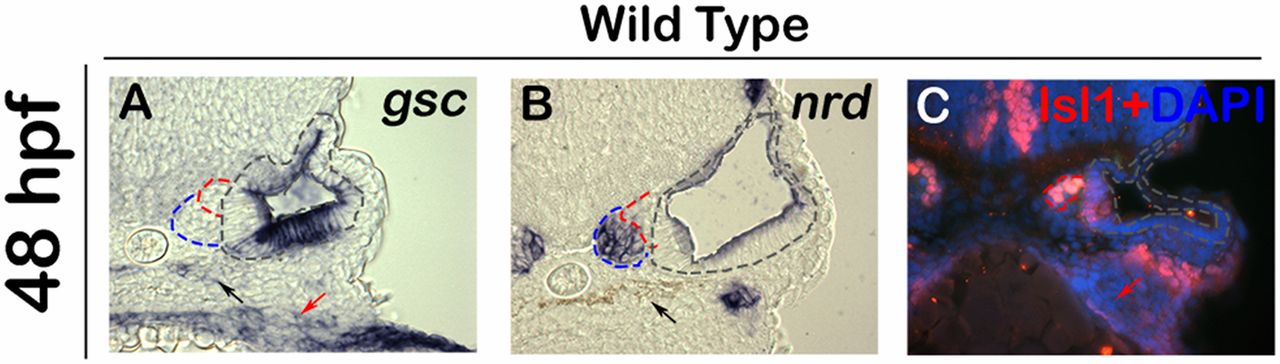
Fig. S1
Expression of gsc during later stages of SAG development. (A–C) Images show expression of gsc (A), nrd (B), and immunodetection of Isl1 in DAPI-stained (C) cross-sections passing through the middle of the otic vesicle in wild-type embryos. The otic epithelium is outlined with black, TA cells are outlined with blue, and mature SAG neurons are outlined in red. Gsc expression is absent from the TA cells or mature SAG neurons. gsc is also expressed in the pharyngeal endoderm (red arrows) and neural crest derived pigment cells (black arrows).
Acknowledgments
This image is the copyrighted work of the attributed author or publisher, and
ZFIN has permission only to display this image to its users.
Additional permissions should be obtained from the applicable author or publisher of the image.
Full text @ Proc. Natl. Acad. Sci. USA