
IMAGE
Fig. 2
Image
|
Figure Caption
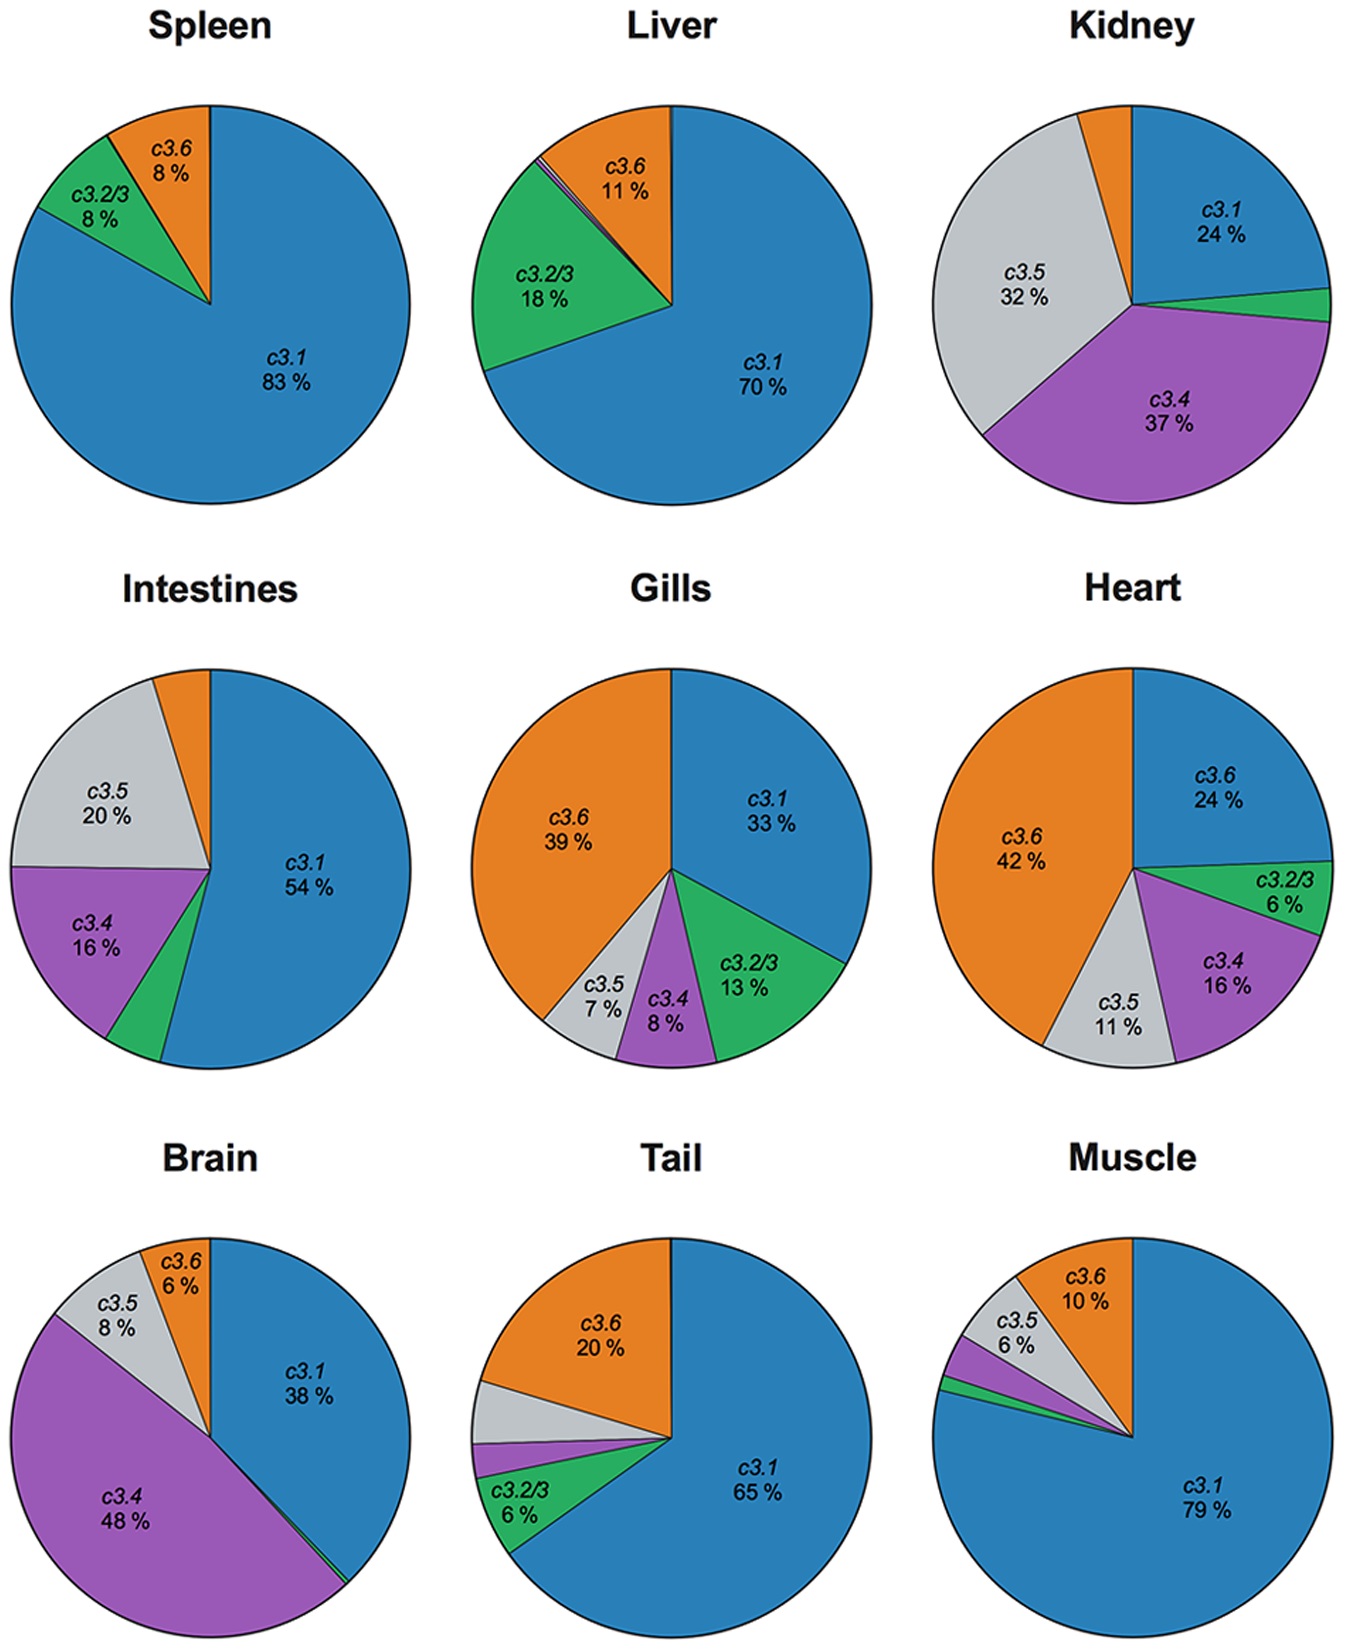
Fig. 2
Basal expression of c3 in adult zebrafish tissues.
c3.1, c3.2/3, c3.4, c3.5, c3.6 and c3.7/8 mRNA expression was evaluated in different adult zebrafish tissues. c3.7/8 was not represented in the graphics due to its low expression in comparison to the other c3 genes. The graphs depict the mean results from 3 different experiments, each using a pool of 4 animals.
Figure Data
Acknowledgments
This image is the copyrighted work of the attributed author or publisher, and
ZFIN has permission only to display this image to its users.
Additional permissions should be obtained from the applicable author or publisher of the image.
Full text @ PLoS One