
Image
|
Figure Caption
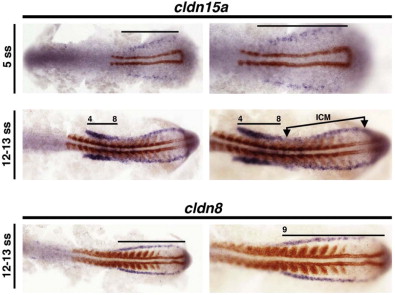
Fig. 5 Renal progenitor expression domains of cldn15a and cldn8. Whole mount in situ hybridization analysis for clnd15a (purple) and myod1 (red) at the 5–13 somite stage (ss) in wild-type embryos. Embryos are shown in dorsal view, flat-mounted, with anterior to the left. Black lines indicated transcript domains, and numbers correspond to the somite position of nephron cells. Abbreviations: inner cell mass (ICM) denotes primitive blood. For interpretation of the references to color in this figure legend, the reader is referred to the web version of this article.
Figure Data
Acknowledgments
This image is the copyrighted work of the attributed author or publisher, and
ZFIN has permission only to display this image to its users.
Additional permissions should be obtained from the applicable author or publisher of the image.
Reprinted from Gene expression patterns : GEP, 16, McKee, R., Gerlach, G.F., Jou, J., Cheng, C.N., Wingert, R.A., Temporal and spatial expression of tight junction genes during zebrafish pronephros development, 104-113, Copyright (2014) with permission from Elsevier. Full text @ Gene Expr. Patterns