
|
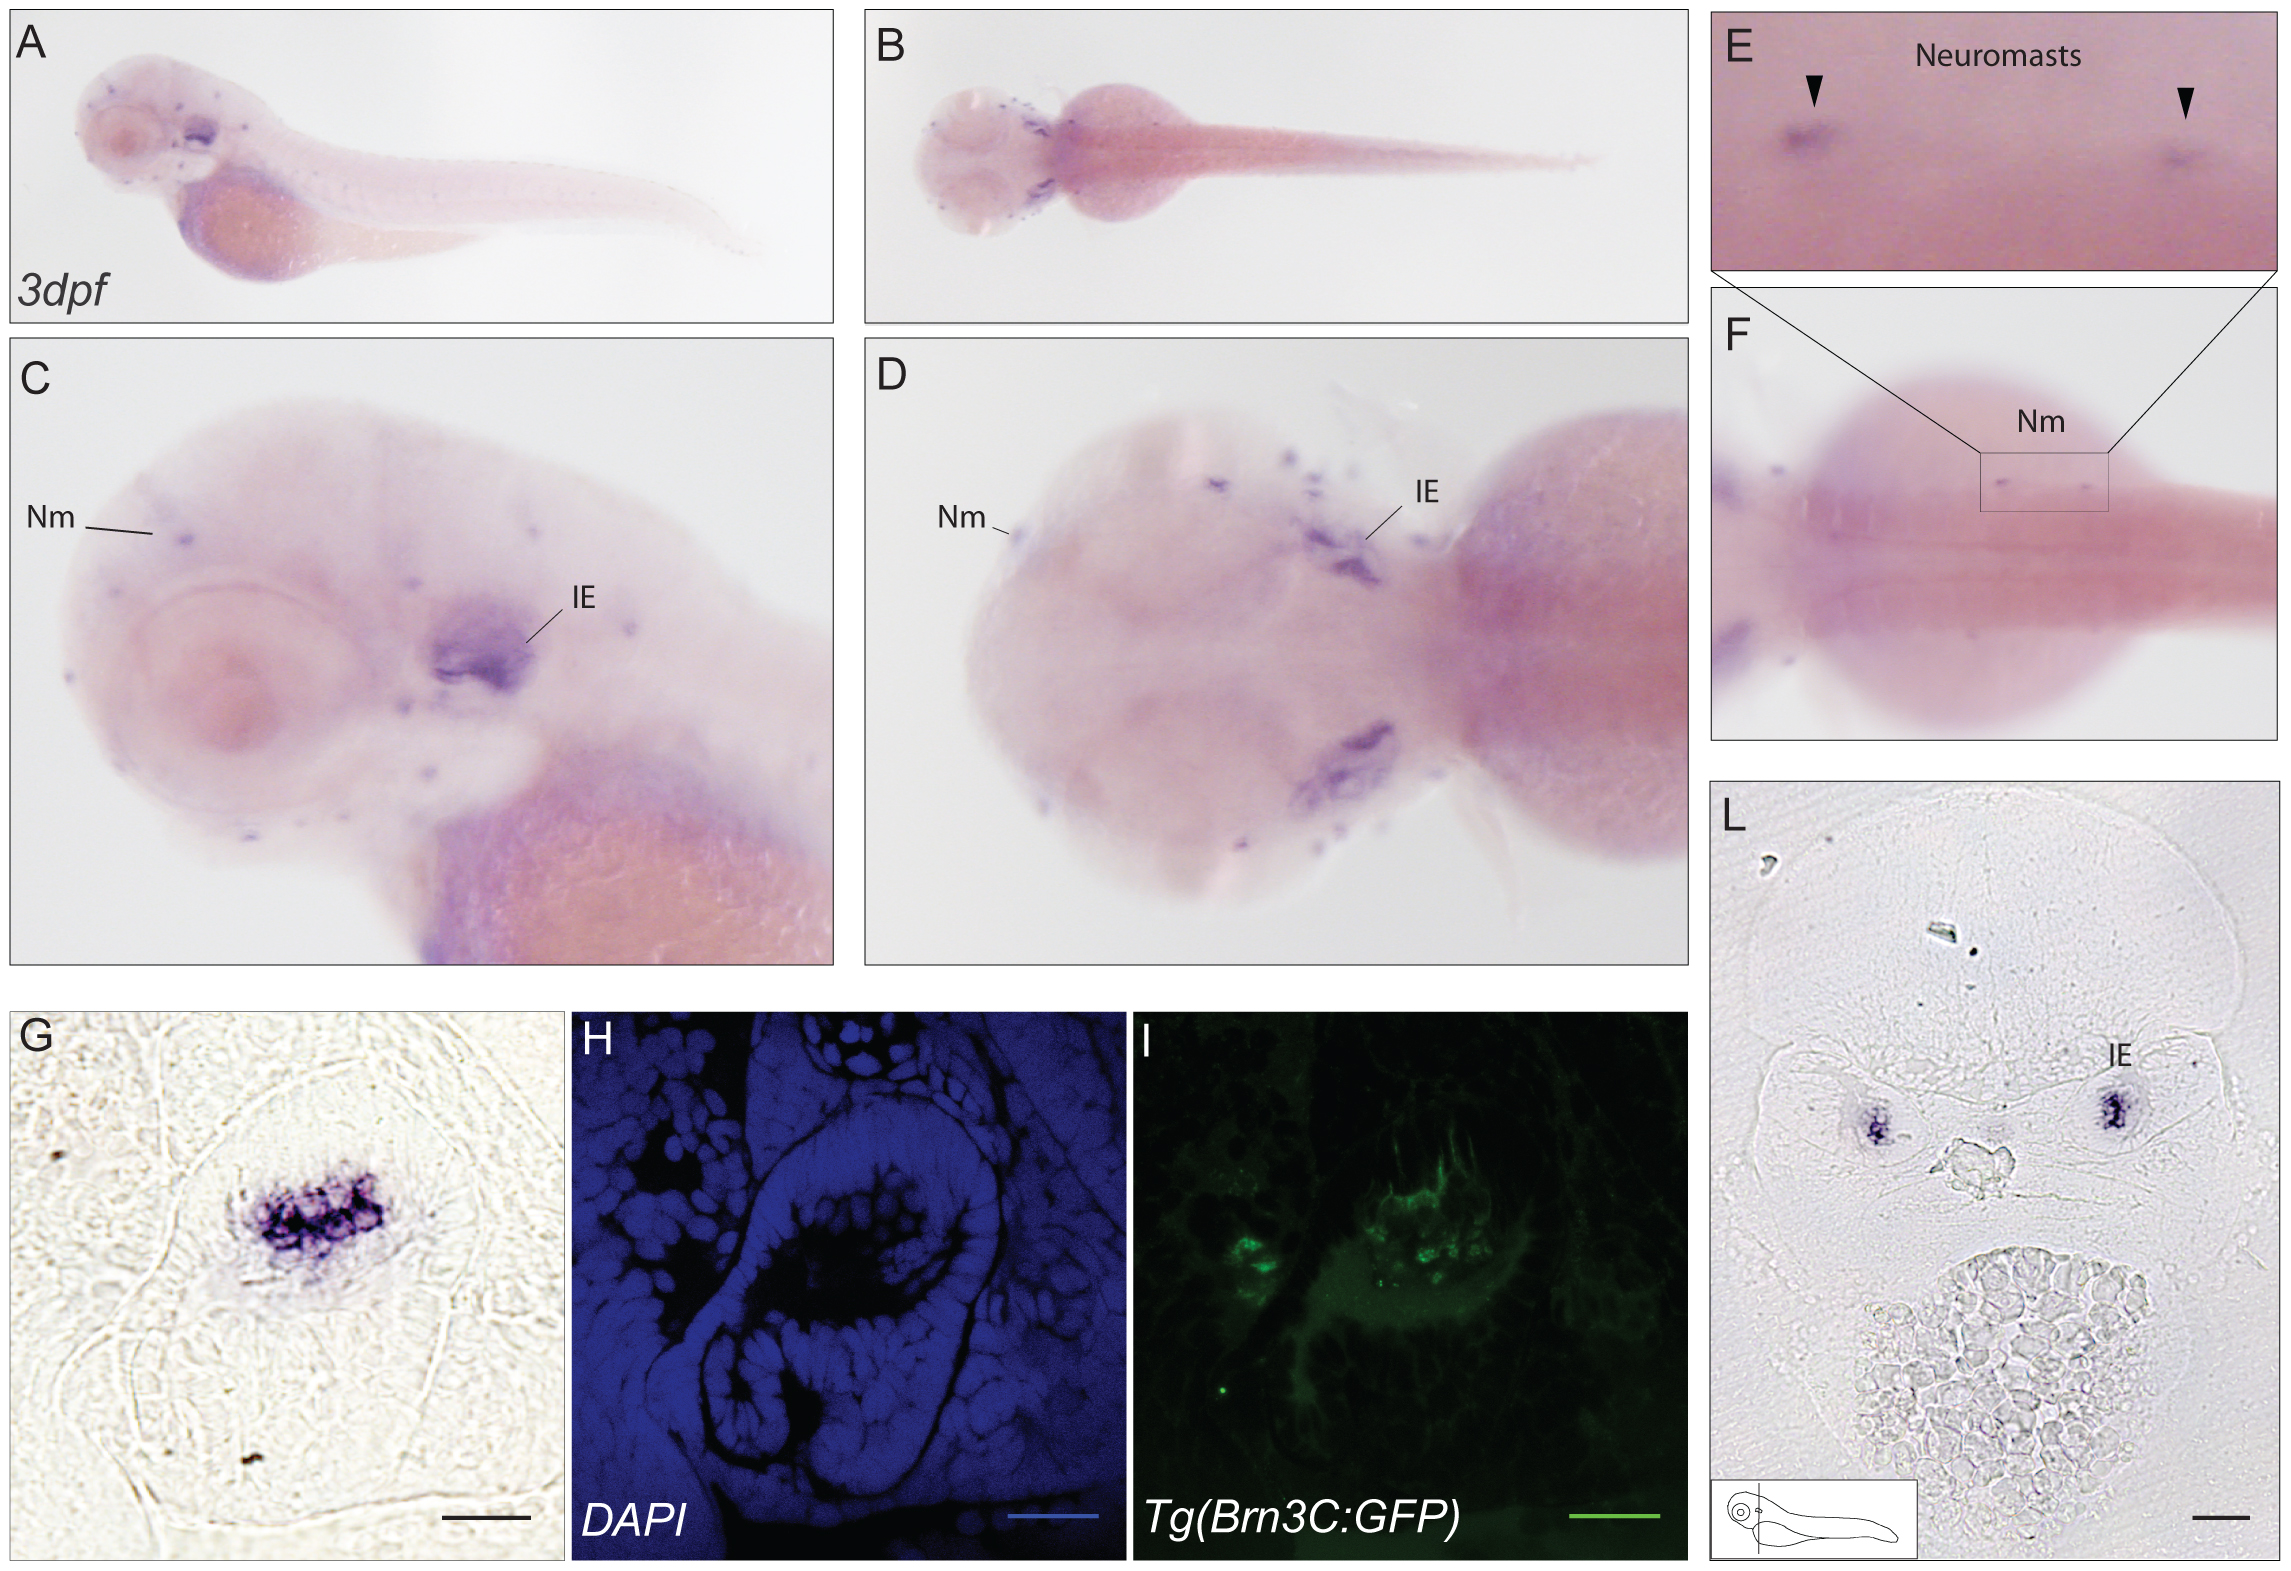
Fig. 5 Expression pattern of cabp2b.
(A–D) In situ hybridisation signal of cabp2b in 3dpf zebrafish embryos. Lateral (A) and dorsal (B) views of the embryo with higher magnification (C–D). Staining is restricted to hair cells in the inner ear and to the neuromasts. (F) View of stained neuromasts in the lateral line and (E) higher magnification of the selected area; arrowheads in E show the neuromasts. (G–L) Transverse section of the ear in the Tg(Brn3C:memGFP) transgenic line. (L) Epifluorescence image, showing strong expression of cabp2b in a subset of cells in the inner ear. Scale bar: 100 µm. (G) Higher magnification picture. (H–I) Confocal images. (H) DAPI signal, (I) GFP staining in the same domain as cabp2b. Scale bar: 20 µm. Nm: neuromast, IE: inner ear.