
Image
|
Figure Caption
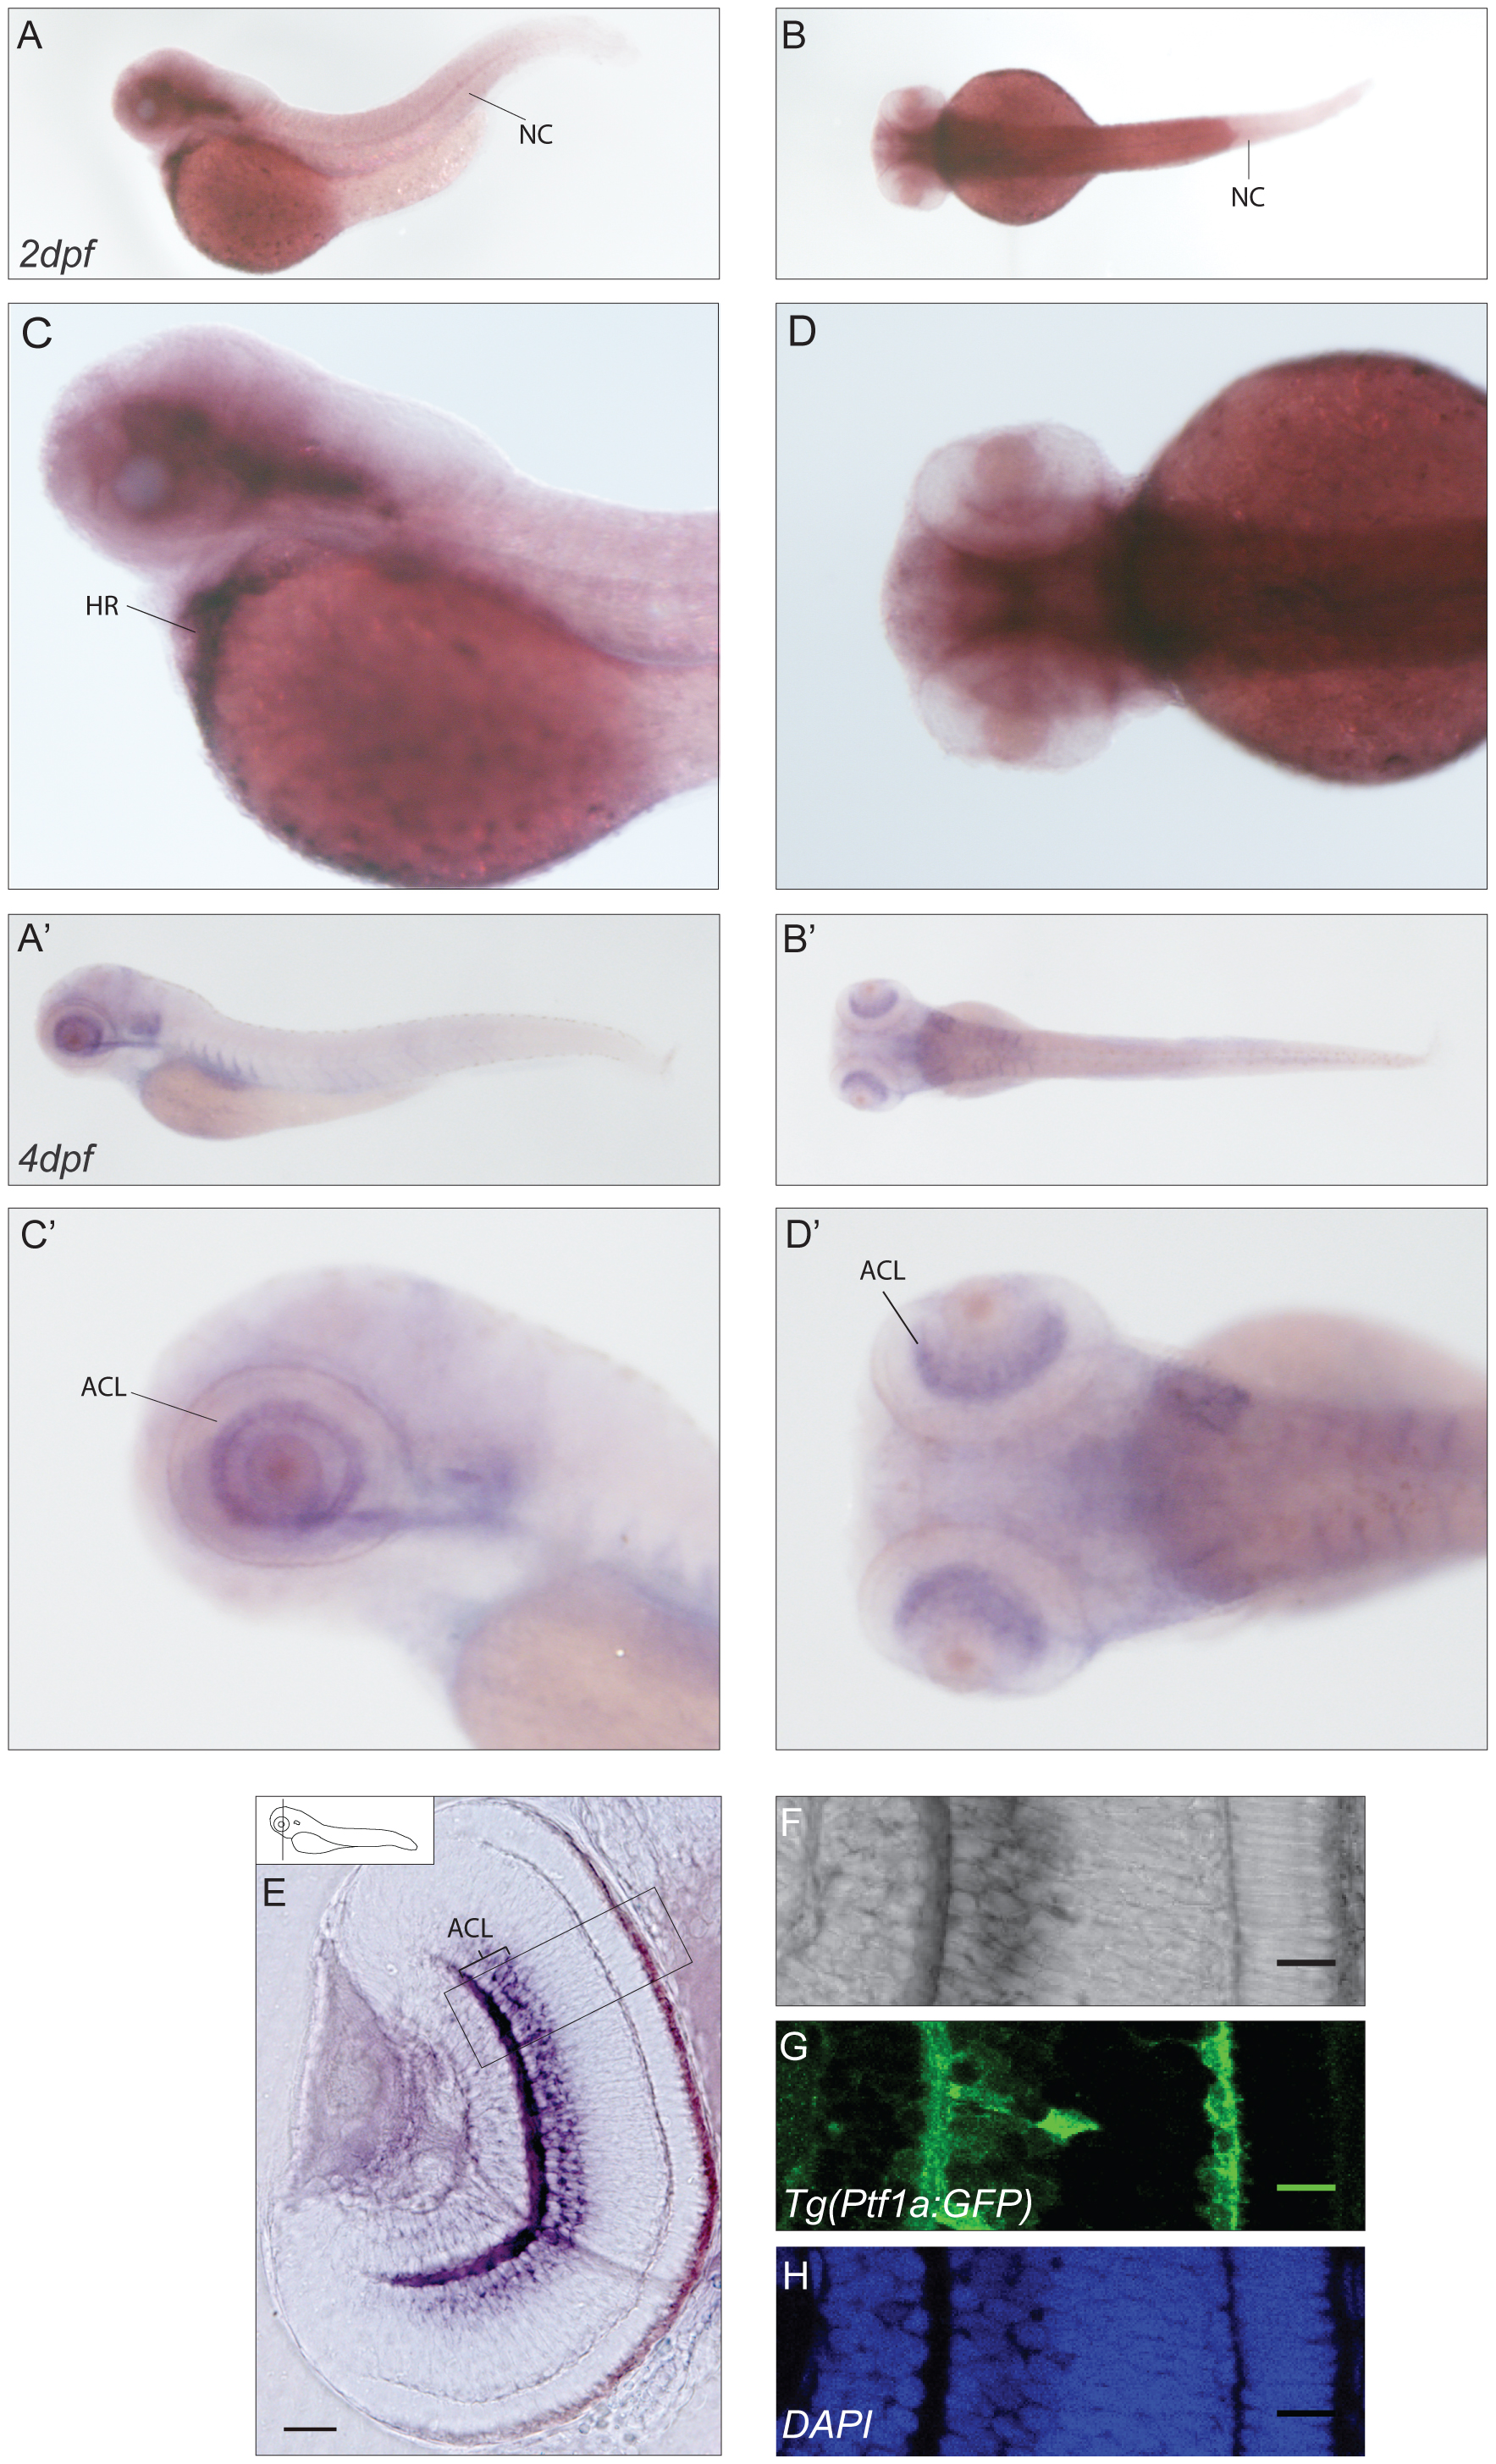
Fig. 2 Expression pattern of cabp1a.
(A–D2) mRNA expression of cabp1a in lateral (A–A2) and dorsal (B,B2) views of a 2dpf and 4dpf zebrafish embryo with higher magnifications (C–D,C2–D2). (E–H). Cross-sections of retinae in the Tg(Ptf1a:GFP) transgenic line show staining of cabp1a in the amacrine cell layer.(E) Epifluorescence picture of a sectioned retina. Scale bar: 50 µm (F–H) Confocal images of the area selected in E. (F) In situ signal in bright field, (G) GFP signal restricted to amacrine cells, (H) DAPI nuclear stain. Scale bar: 20 µm. HR: heart, NC: notochord, ACL: amacrine cell layer.
Figure Data
Acknowledgments
This image is the copyrighted work of the attributed author or publisher, and
ZFIN has permission only to display this image to its users.
Additional permissions should be obtained from the applicable author or publisher of the image.
Full text @ PLoS One