
|
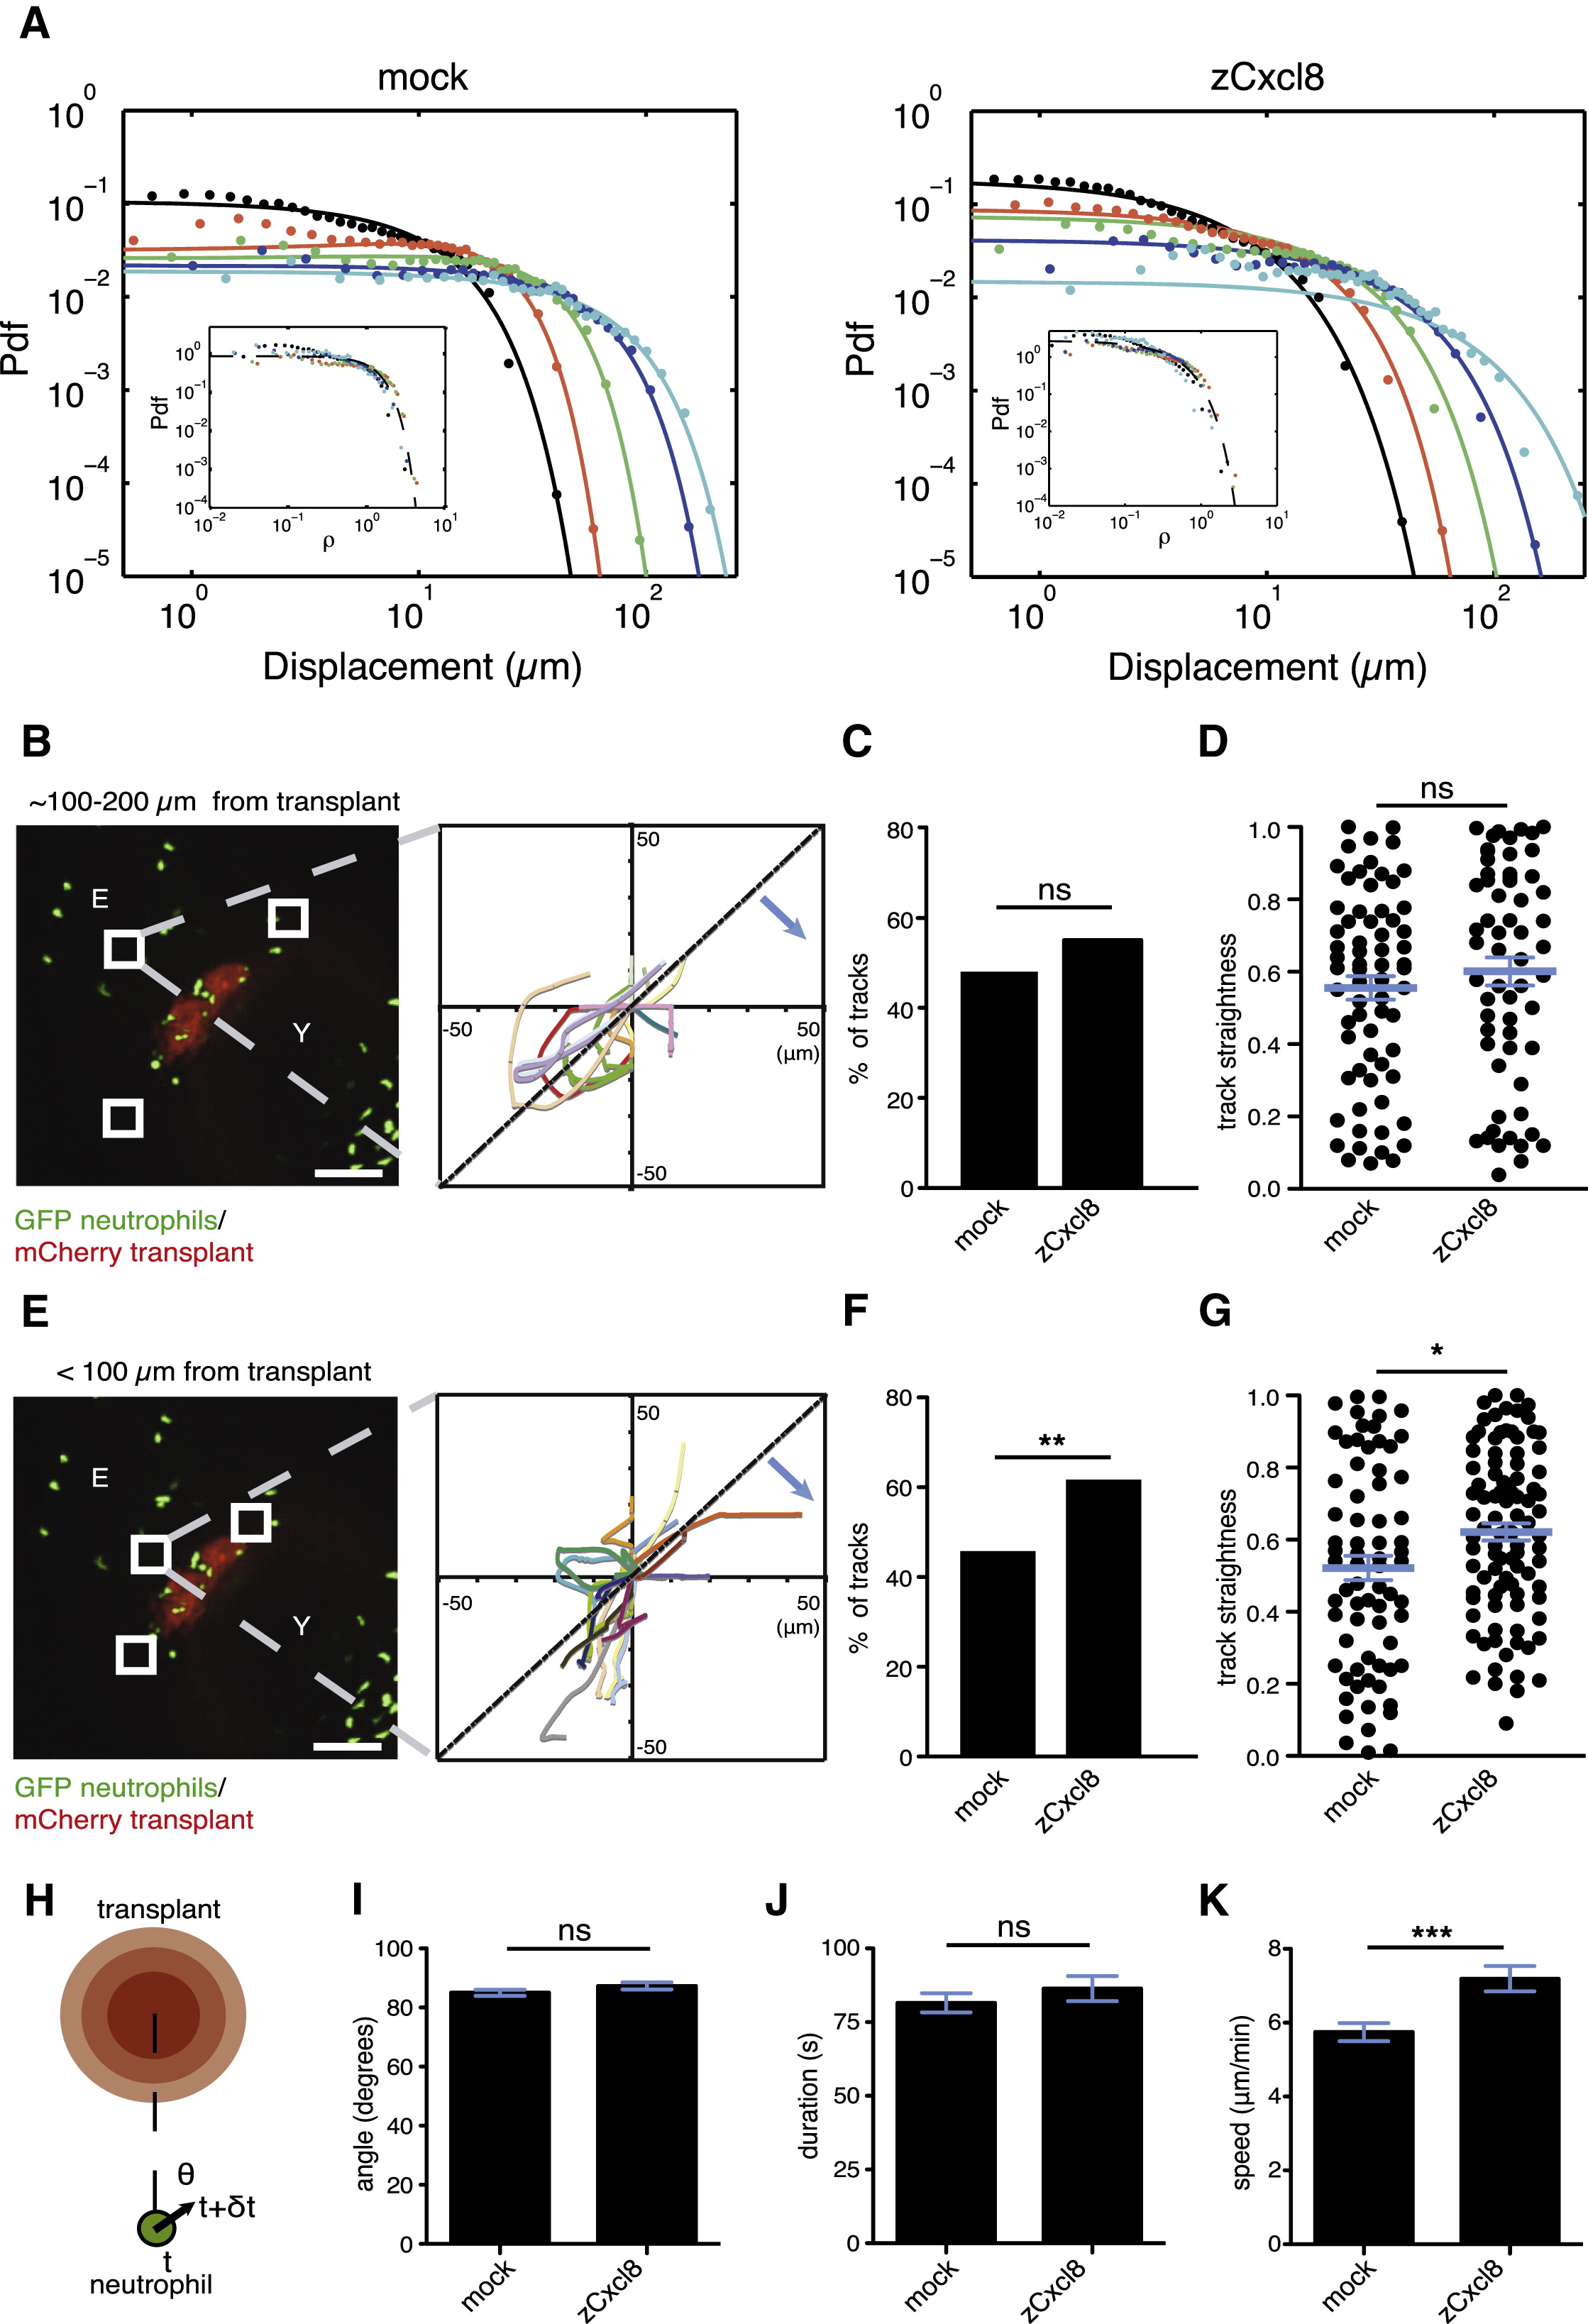
Fig. 2 zCxcl8 Imposes an Orthotactic Bias on Neutrophil Random Walk(A) Evolution of the propagator, i.e. the probability density function (Pdf) of neutrophil displacement r(t) at different times t, in larvae with mock or zCxcl8 transplants. Points are the results of the experiments and lines are Gaussian fits. Colors are associated with times: black for t = 1 min, red for t = 2 min, green for t = 4 min, blue for t = 8 min, and cyan for t = 16 min. Plots are in log-log scale. Insets are the collapsed curves, P(ρ), into a unique Gaussian. Black line is the Gaussian fit. Data are from four larvae in four experiments.(B and E) Left panels: representative SDCM images of neutrophils (green) within the area of transplanted cells (red). Representative 50 × 50 × 50 μm cubes indicate example areas covering <100–200 μm (B) or <100 μm (E) distance from transplant, such as were used for motility analysis shown in (C) and (D) and in (F) and (G), respectively. E, eye; Y, yolk sac. Scale bars represent 100 μm. Right panels: tracks of neutrophils within the indicated representative cube. Blue arrows indicate the direction toward the transplant.(C and F) Proportion of tracks within <100–200 μm or <100 μm from the transplant, respectively, that moved toward the transplant. For (C), mock: n = 141, zCxcl8: n = 109; for (F), mock: n = 155; zCxcl8: n = 154 (Fisher′s exact test for tracks moving toward or away from transplant).(D and G) Straightness (displacement/path length) of tracks within ~100–200 μm or <100 μm from transplant, respectively, that migrated toward the transplant. For (D), mock n = 68; zCxcl8: n = 60; for (G), mock: n = 71; zCxcl8: n = 95 (Mann-Whitney test). Error bars indicate SEM. ns, not significant; p < 0.05; p < 0.01.(H) Approach angle θ toward transplant for neutrophil steps made in time interval, δt = 30 s.(I) Average approach angles for individual neutrophil steps. Mock: n = 2,585; zCxcl8: n = 2,138 (Mann-Whitney test). Error bars indicate SEM. ns, not significant.(J) Average time during which a cell maintained orientation toward (θ < 90°) the transplant. zCxcl8: n = 380; mock: n = 500. (Mann-Whitney test). ns, not significant.(K) Average speed of neutrophil steps with approach angles to the transplant <45°. Mock: n = 702; zCxcl8: n = 564 (Mann-Whitney test). Error bars indicate SEM. p < 0.0001.Pooled data from several cubes in three larvae per case, from three independent experiments, are shown in (C), (D), (F), (G), and (I)–(K). See also Figure S2.