
|
Fig. 1
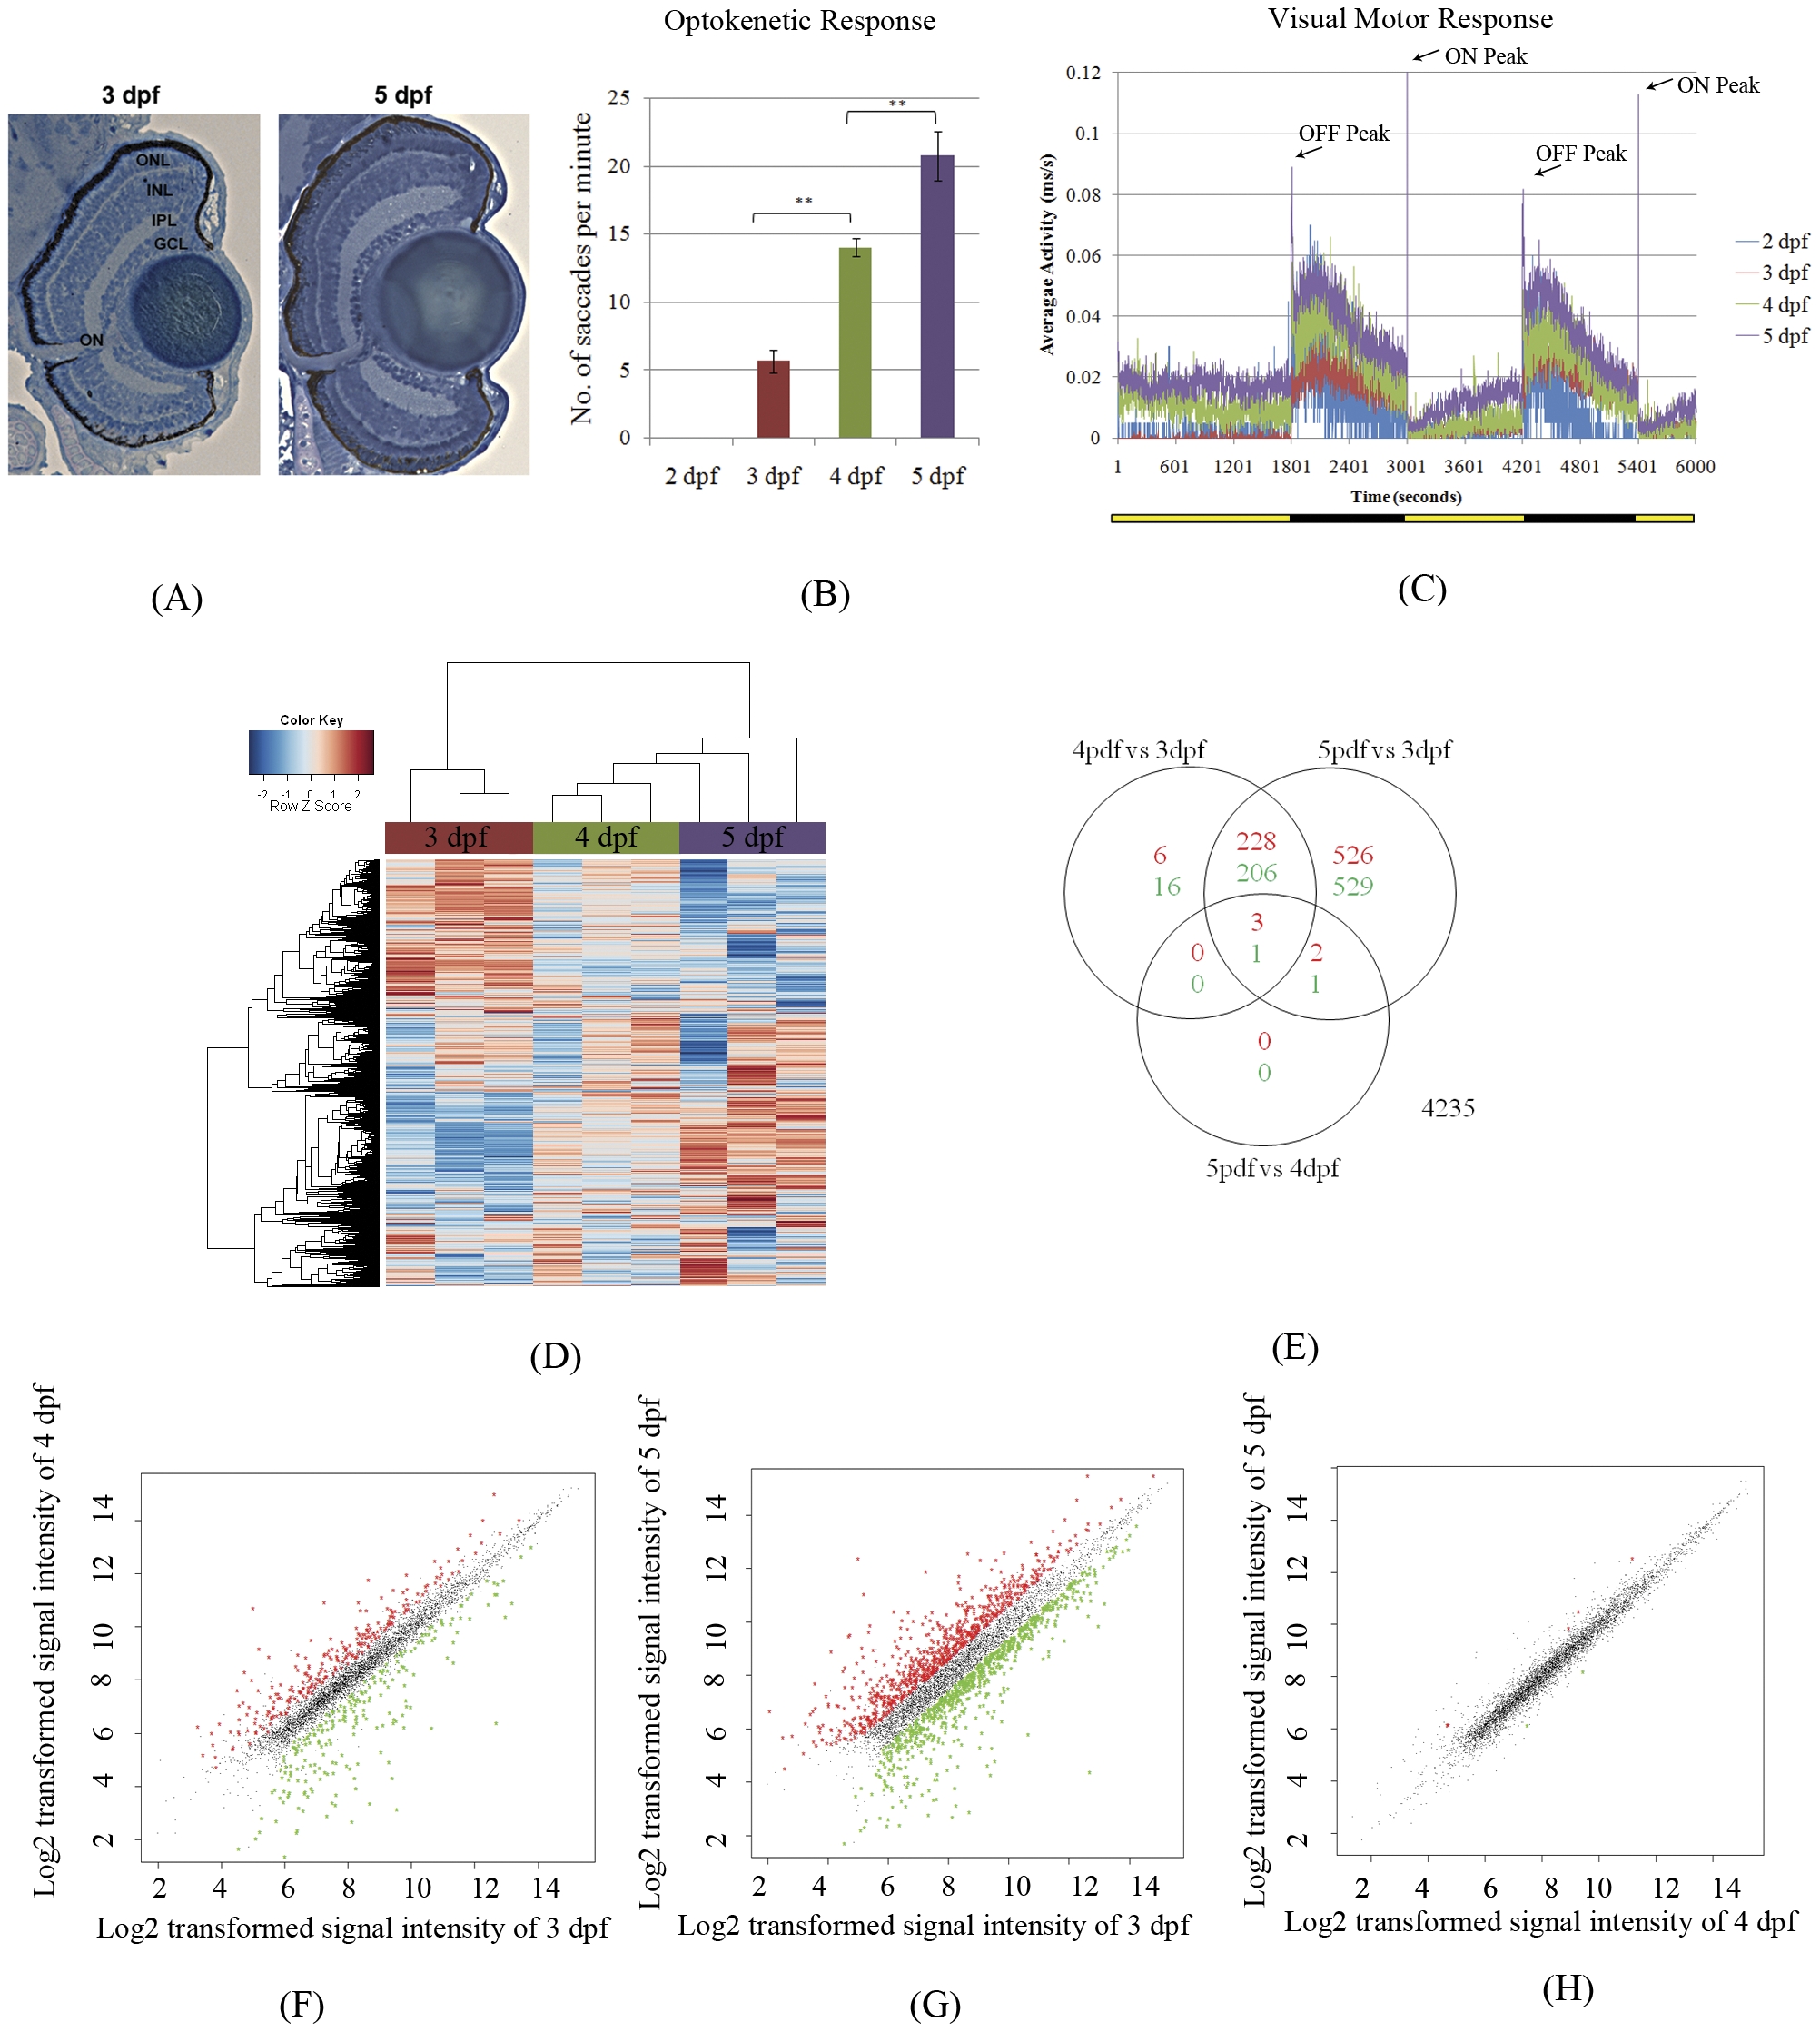
Maturation of visual function and correlations to gene expression in larval zebrafish.
(A) The morphology of the zebrafish retina shows no significant changes from 3–5 dpf. However, the OKR (B) and the VMR (C) show significant increases in the number of eye saccades or the amplitude of locomotor responses to light changes from 3–5 dpf. Lights on is shown as a yellow bar below the diagram, and lights off is shown as a black bar. (D–H) Overview of microarray results of eye gene expression for 3, 4 and 5 dpf zebrafish eyes. (D) Hierarchical clustering of gene expression was based on normalized signals (z-scores) using the correlation similarity metric and average linkage clustering. (E) Venn diagram showing the number of up-regulated and down-regulated transcript-level probe sets between pairwise comparisons using the limma Bayesian model based t-test. (F–H) Log2 transformed signal intensities of probe sets are depicted as dots, with up-regulated probe sets in red and down-regulated sets in green.