
|
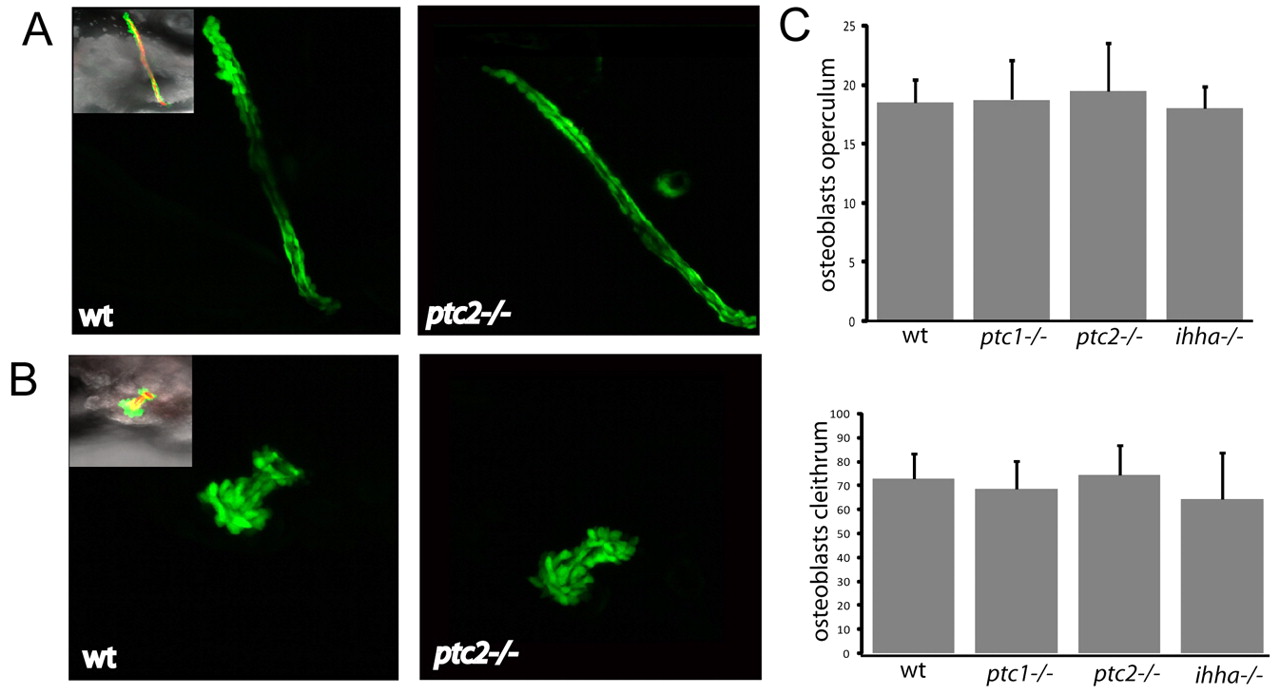
Fig. 2 Mutants with altered Hh signalling show no differences in the number of osterix-positive cells in dermal bone elements. (A) Confocal stacks of the cleithra of osterix-nuclear GFP fish at 4 dpf. Inset image on left is a merged image of Tg(osx:nuGFP) (green), Alazarin Red and brightfield images. (B) Confocal stacks of the operculum of osterix-nuclear GFP fish at 4 dpf. Inset image on left is a merged image of Tg(osx:nuGFP) (green), Alazarin Red and brightfield images. (C) Quantification of the number of osterix-positive nuclei in the cleithrum (below) and operculum (above) at 3 and 4 dpf. Data is shown as mean±s.d. taken of at least four fish per genotype. *P<0.05 versus wild type. wt, wild type.