
|
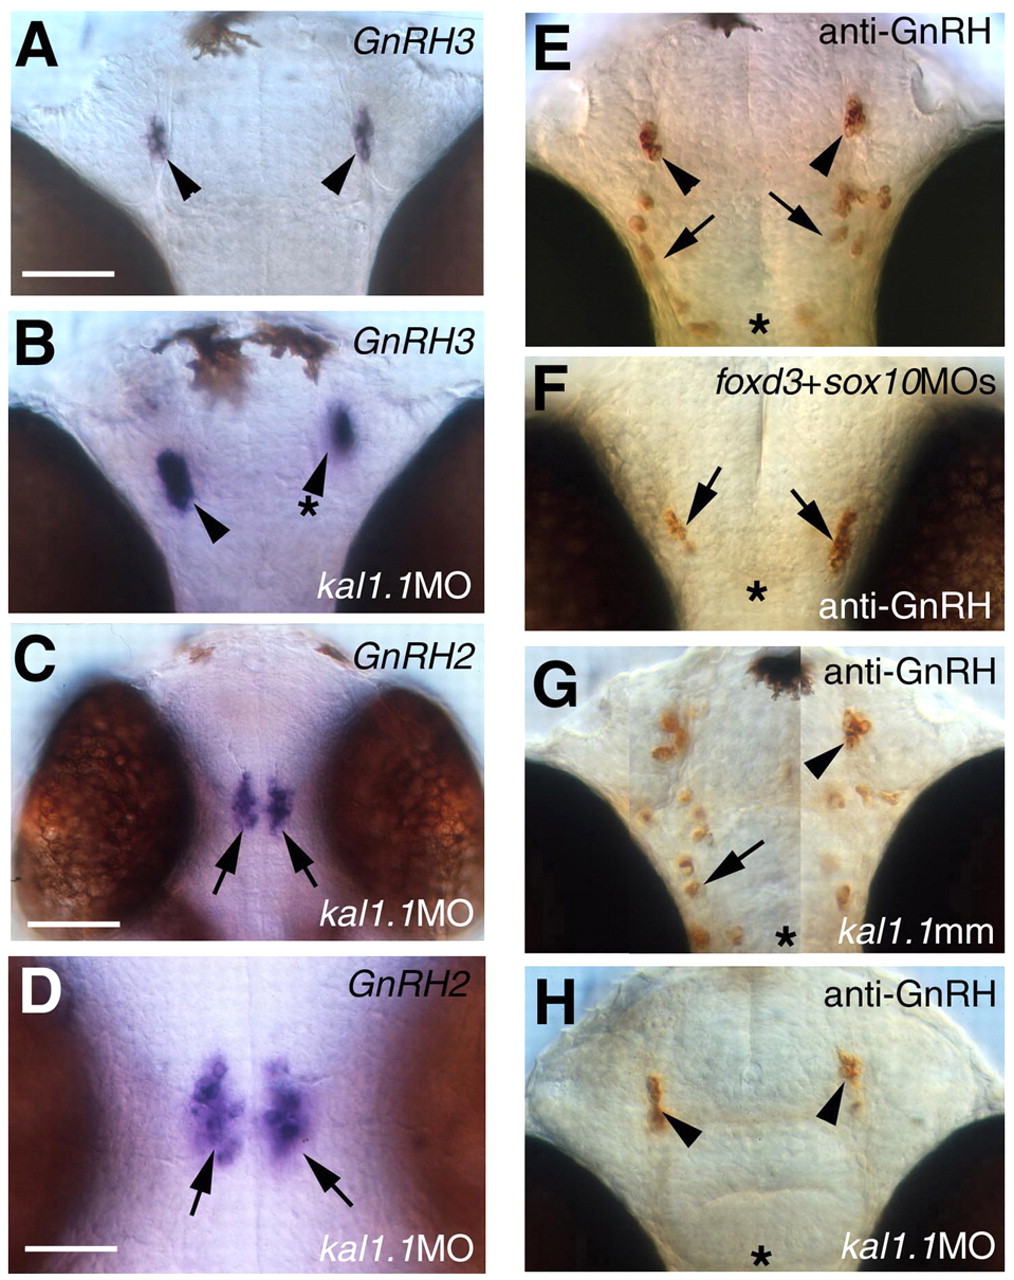
Fig. 9 Role of foxd3, sox10 and kal1.1 in the development of GnRH cells. (A) Normal pattern of gnrh3 expression in cells of the terminal nerve (arrowheads). (B) gnrh3 cells were present in normal numbers in kal1.1 morphants, but could be disorganized; arrowhead with asterisk indicates gnrh3 cells displaced dorsally. (C,D) gnrh2 cells (arrows) were present in normal numbers in kal1.1 morphants. (E-H) Effects of foxd3+sox10 and kal1.1 knockdown on the development of hypothalamic GnRH, visualized using a pantropic anti-GnRH antibody. (E) Normal pattern of GnRH-IR showing hypothalamic GnRH cells (arrows) extending back to the post-optic commissure (asterisk), and terminal nerve GnRH3 cells (arrowheads). (F) Presence of GnRH cells of the hypothalamus (arrows) was not affected by knockdown of foxd3 and sox10, but these cells were clustered near the region of the post-optic commissure (asterisk). (G) Normal pattern of GnRH immunoreactivity obtained in kal1.1 mismatch controls (arrowhead, terminal nerve cells; arrow, hypothalamic cells). (H) Knockdown of kal1.1 eliminated the hypothalamic population of cells but did not affect the development of the terminal nerve cells (arrowhead; cf. B). All embryos were 56±1 hpf. Scale bars: 70 µm in A,B,E-H; 100 µm